
Measure traffic, speeds and emissions across your entire
road network
NEXQT reconstructs real traffic flows on your network using GPS data from the vehicles traveling on it. No sensors to install, no counting campaigns: your teams have the data they need from day one.


For local authorities and businesses
Daily data with 5 years of history
Entire road network across all territories
Passenger cars, light commercial vehicles, and heavy goods vehicles
Referenced solution






Measure traffic, speeds and emissions across your entire road network
NEXQT reconstructs real traffic flows on your network using GPS data from the vehicles traveling on it. No sensors to install, no counting campaigns: your teams have the data they need from day one.
For local authorities and businesses
Daily data with 5 years of history
Entire road network across all territories
Passenger cars, light commercial vehicles, and heavy goods vehicles
Referenced solution

For local authorities and businesses
Daily data with 5 years of history
Entire road network across all territories
Passenger cars, light commercial vehicles, and heavy goods vehicles
Referenced solution
Deployed across more than 70 territories
Deployed across more than 70 territories



The Challenge
The Challenge
Your decisions are based on traffic data that is outdated, incomplete, and expensive to obtain.
Your decisions deserve reliable, up-to-date data
Your decisions deserve reliable, up-to-date data
Without continuous measurement, the real evolution of traffic flows remains invisible due to an information gap: new transit routes, the effects of a new development, drift in travel times. NEXQT reconstructs this data across your entire road network.
Without continuous measurement, the real evolution of traffic flows remains invisible due to an information gap: new transit routes, the effects of a new development, drift in travel times. NEXQT reconstructs this data across your entire road network.
Deployed across more than 70 territories
Traffic, speed, and emissions data for your entire road network
No sensors to install, no costly measurement campaigns: NEXQT delivers the digital twin of your road network and gives your teams the data they need to manage mobility.

Measure traffic, speeds and emissions across your entire road network
NEXQT reconstructs real traffic flows on your network using GPS data from the vehicles traveling on it. No sensors to install, no counting campaigns: your teams have the data they need from day one.

Traffic, speed, and emissions data for your entire road network
No sensors to install, no costly measurement campaigns: NEXQT delivers the digital twin of your road network and gives your teams the data they need to manage mobility.
Measure traffic, speeds and emissions across your entire road network
NEXQT reconstructs real traffic flows on your network using GPS data from the vehicles traveling on it. No sensors to install, no counting campaigns: your teams have the data they need from day one.
Without NEXQT
Patchy and costly data
Patchy and costly data

Measurements limited to a few roads and a few days
Measurements limited to a few roads and a few days leave an information gap
Measurements limited to a few roads and a few days leave an information gap

A snapshot that quickly becomes obsolete as soon as construction or a new development alters traffic flows.
A snapshot that quickly becomes obsolete as soon as construction or a new development alters traffic flows.
A snapshot that quickly becomes obsolete as soon as construction or a new development alters traffic flows.

No visibility on traffic shifts to neighboring routes
No visibility on traffic shifts to neighboring routes
No visibility on traffic shifts to neighboring routes
Travel times that are declared or taken from the outgoing operator, never actually measured on the ground
Travel times that are declared or taken from the outgoing operator, never actually measured on the ground
Travel times that are declared or taken from the outgoing operator, never actually measured on the ground
Decisions that are difficult to justify to residents, elected officials, or the organizing authority
Decisions that are difficult to justify to residents, elected officials, or the organizing authority
Decisions that are difficult to justify to residents, elected officials, or the organizing authority
With NEXQT
The digital twin of your network
The digital twin of your network

Full network coverage, without physical sensors
Full network coverage, without physical sensors
Full network coverage, without physical sensors
Traffic, speeds, and emissions for all vehicle types
Trafic, vitesses, émissions, origines-destinations et flux de transit, pour tous les types de véhicule
Trafic, vitesses et émissions pour tous les types de véhicules
Segment by segment, day by day, over five years of history
Segment by segment, day by day, over five years of history
Segment by segment, day by day, over five years of history
Real travel times by route and time slot, to assess infrastructure projects, disruptions, or respond to a Public Service Delegation (DSP)
Real travel times by route and time slot, to assess infrastructure projects, disruptions, or respond to a Public Service Delegation (DSP)
Real travel times by route and time slot, to assess infrastructure projects, disruptions, or respond to a Public Service Delegation (DSP)
A simple interface, accessible without technical expertise to all departments: roadworks, road safety, line operations, energy transition
A simple interface, accessible without technical expertise to all departments: roadworks, road safety, line operations, energy transition
A simple interface, accessible without technical expertise to all departments: roadworks, road safety, line operations, energy transition
02

100% of your network covered

02

Traffic speed emissions
03

Section by section
02
100% of your network covered
02
Traffic speed emissions
03
Section by section
02
100% of your network covered
02
Traffic speed emissions
03
Section by section
The Challenge
Your decisions deserve reliable, up-to-date data
Without continuous measurement, the real evolution of traffic flows remains invisible due to an information gap: new transit routes, the effects of a new development, drift in travel times. NEXQT reconstructs this data across your entire road network.
Without NEXQT
Patchy and costly data
Measurements limited to a few roads and a few days leave an information gap
A snapshot that quickly becomes obsolete as soon as construction or a new development alters traffic flows.
No visibility on traffic shifts to neighboring routes
Travel times that are declared or taken from the outgoing operator, never actually measured on the ground
Decisions that are difficult to justify to residents, elected officials, or the Mobility Organizing Authority.
With NEXQT
The digital twin of your network
Full network coverage, without physical sensors
Traffic, speeds, and emissions for all vehicle types
Segment by segment, day by day, over five years of history
Real travel times by route and time slot, to assess infrastructure projects, disruptions, or respond to a Public Service Delegation (DSP)
A simple interface, accessible without technical expertise to all departments: roadworks, road safety, line operations, energy transition
01
100% of your network covered
02

03
Where does our data come from?
Robust, representative data for the territory, sourced from vehicles

Calibrated data, not raw data
NEXQT calibre ensuite ces données FCD grâce à un modèle physique de trafic et un algorithme d'apprentissage, confrontés aux compteurs permanents de référence.
NEXQT s'appuie sur les données FCD (Floating Car Data)
Les signaux GPS anonymisés transmis en continu par les véhicules connectés qui circulent sur votre réseau. Chaque véhicule transmet sa position et sa vitesse, ce qui permet de reconstituer les flux réels sans installer le moindre capteur.

+30 constructeurs
automobiles
Ces données agrègent les signaux de plus de 30 constructeurs (Renault, VW, Toyota…) automobiles et poids lourds, européens, américains et asiatiques. En France, cela représente plusieurs milliards de traces GPS par an, couvrant l'ensemble du réseau routier.
Published and verifiable reliability
Le résultat est un TMJA quantifié, fiable, tronçon par tronçon, y compris là où aucun capteur n'existe, et une méthodologie publiée dans des revues scientifiques internationales de premier rang. Les données sont anonymisées et le traitement est conforme au RGPD.

Where does our data come from?
Robust, representative data for the territory, sourced from vehicles
Where does our data come from?
Robust, representative data for the territory, sourced from vehicles
Published and verifiable reliability
The result is reliable data, quantified segment by segment, with a methodology published in leading international scientific journals. The data is anonymized and the processing is compliant with GDPR.
Calibrated data, not raw data
NEXQT then calibrates this FCD data using a physical traffic model and a machine learning algorithm, validated against reference permanent traffic counters.
Published and verifiable reliability
The result is reliable data, quantified segment by segment, with a methodology published in leading international scientific journals. The data is anonymized and the processing is compliant with GDPR.
NEXQT uses FCD (Floating Car Data)
Anonymized GPS signals continuously transmitted by connected vehicles traveling on your network. Each vehicle transmits its position and speed, allowing us to reconstruct actual traffic flows without installing any sensors.
+30 car manufacturers
These data aggregate signals from more than 30 automotive and truck manufacturers (Renault, VW, Toyota, etc.), including European, American, and Asian brands. In France, this represents several billion GPS traces per year, covering the entire road network.
Your benefits
What you get out of it

Significantly cheaper than a study
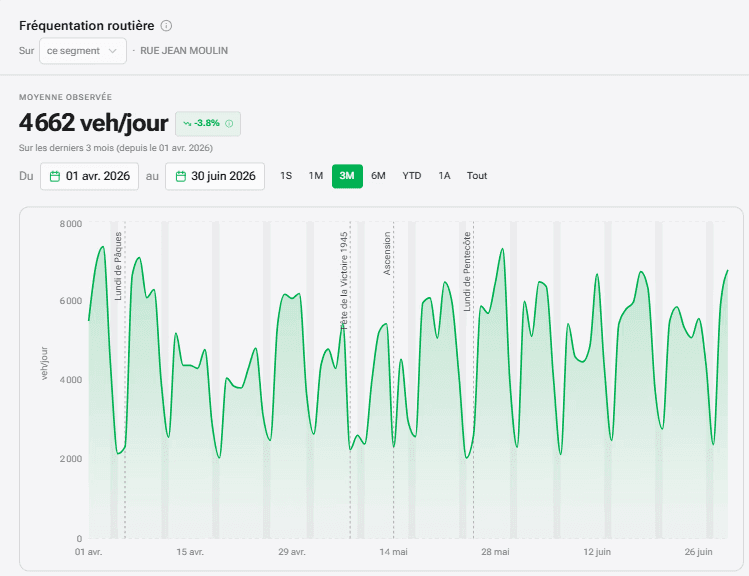
A counting campaign costs €5,000 to €10,000 per road, for a single location and a single moment.

Your teams, more autonomous
Training and support included. Your staff can produce their own analyses.

Always up-to-date data
Automatic monthly updates, with daily figures down to sub-hourly levels.

5 years of data available
No waiting or installation: five years of history for each segment, available from deployment.

Controlled quality of service
Construction site, diversion: measure the difference in travel times and justify a contract amendment to the AOM.
For whom?
Designed for local authorities and businesses.
Traffic data for all your roads
5 years of history
01
02
03
04
05
/03
Local authorities and departments
Territories of all sizes, from municipalities to Departments, both urban and rural, in France and Europe.
Mobility Organizing Authority
Observed traffic data across your entire area, to help decide on mobility plans and monitor their real effects.
Businesses
Public transport network operators (buses, coaches) and logistics and freight transport companies: real travel times by road, direction, and time slot, and measurement of the impact of disruptions.
Use Cases
A platform serving all your departments.
"Has my cycle path changed traffic flows in the neighborhood?"
Assess the impact of a cycling infrastructure project at the operation and neighborhood level, on both traffic and emissions. Concrete, quantified support for your Bike Plan.

"On which data should I base my travel times?"
NEXQT reports the speeds actually observed by segment, by direction and by time slot, and reconstructs travel times along your routes. You build your service design and your punctuality commitments on measured data, not on the outgoing operator's figures.

"How can I feed and monitor my mobility plan?"
Get a full network diagnosis by road hierarchy: congestion points, roads with recurring heavy traffic, zones with excessive speed.

"What is the actual cost of this construction site to my lines?"
Bridge closure, diversion, long-term works: measure the difference in travel time, traffic shifts to alternative routes, and the actual duration of the effect. Concrete, sourced data to justify service adjustments, contract amendments, or compensation to the AOM.

"Where are speed limits not being respected?"
NEXQT provides actually observed speeds (V15, V85, average speed) for each segment. Compare them to current limits and identify roads with recurring speeding issues with citizens and elected officials.

"What is the real effect of this project on traffic?"
Compare flows, speeds, and traffic shifts before and after a bypass, roundabout, or cycle path, road by road, over five years of history. You measure instead of estimating.

An example
The redevelopment of Rue du Général Leclerc
In Le Kremlin-Bicêtre, how do you measure the real effect of a 3-meter two-way bike lane and the removal of 25 parking spaces, on the street itself and on the surrounding neighborhood?
01.

The context

The method
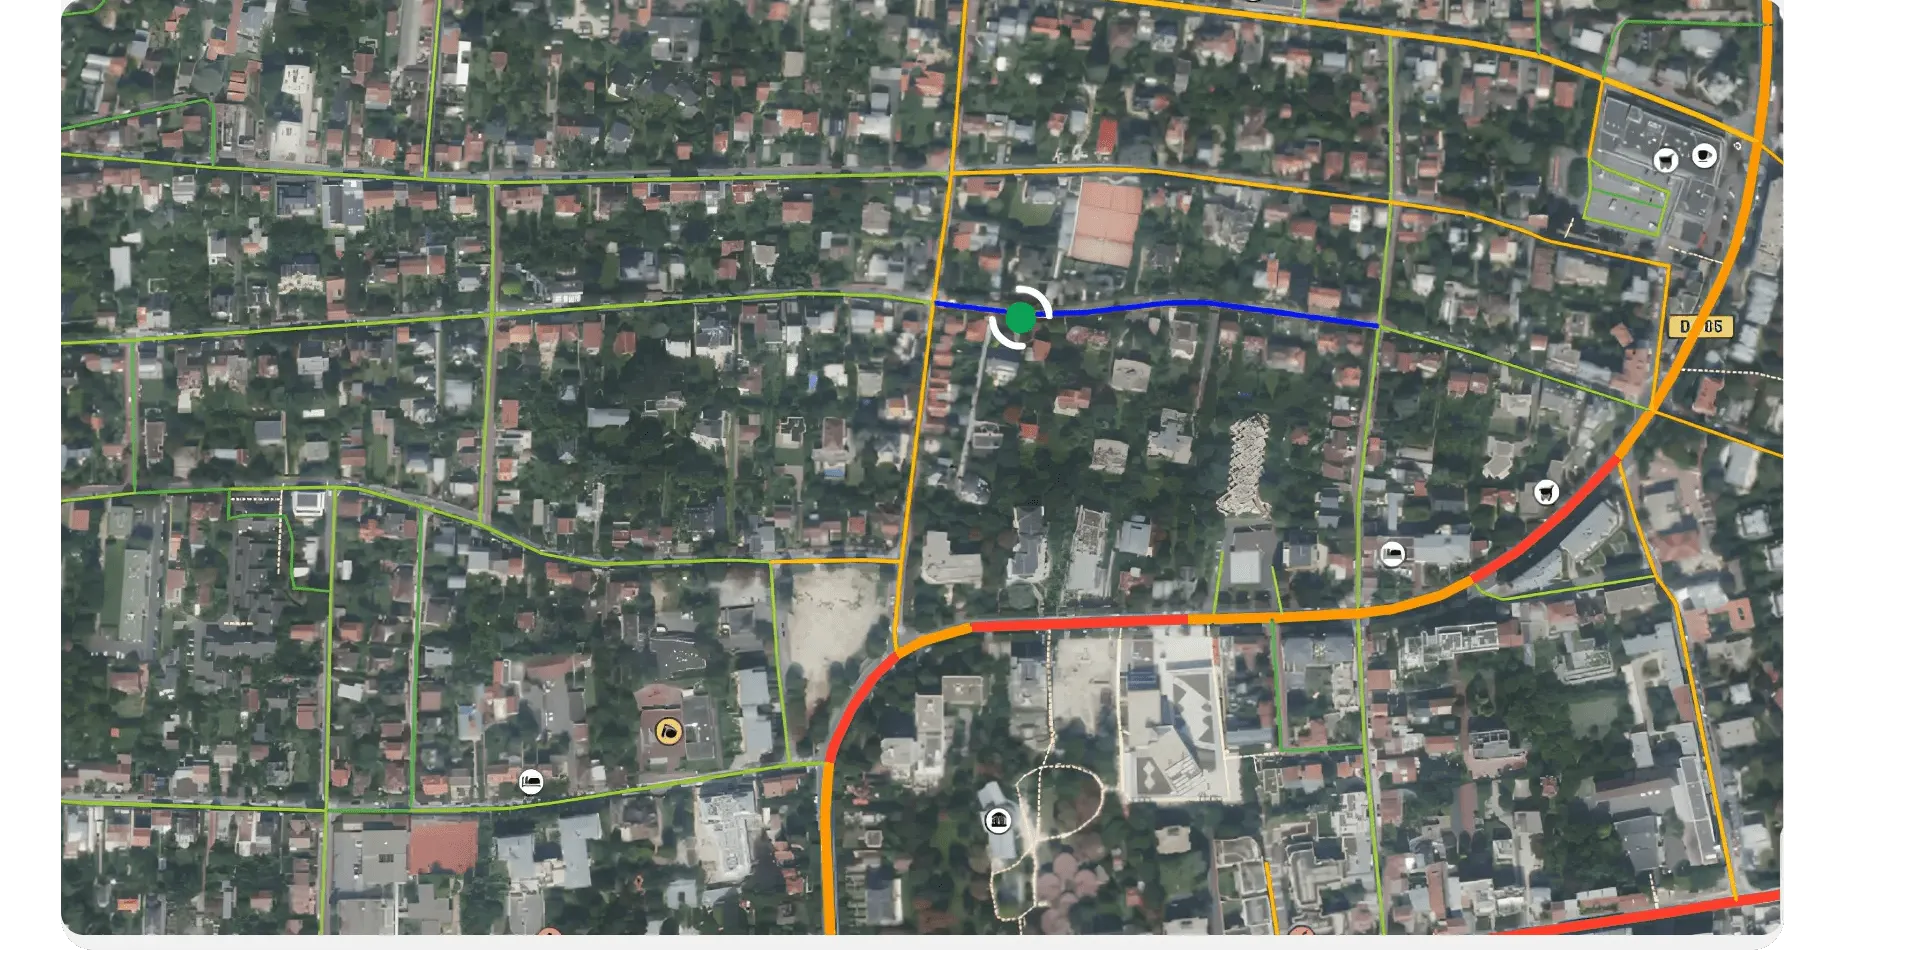
En quelques clics, l’agent sélectionne la zone d’impact sur la carte, puis compare le trafic et les vitesses avant et après l’aménagement, tronçon par tronçon, sur la période.
03.
The results
04.

The use

The context
Avant l’aménagement, la rue était bordée de stationnement continu. Après, une piste cyclable bidirectionnelle a pris place.
The method
En quelques clics, l’agent sélectionne la zone d’impact sur la carte, puis compare le trafic et les vitesses avant et après l’aménagement, tronçon par tronçon, sur la période.

The results
52 % de trafic en moins sur l’axe aménagé et 13 % en moins sur la zone d’impact élargie, entre 2022 et 2025. Des chiffres factuels, exportables et vérifiables.

The use
Objectiver le dialogue avec les riverains, les élus et les partenaires : répondre aux interrogations sur des données réelles plutôt que sur des impressions.
Your custom diagnosis
Let's discuss your project: in 30 minutes, let's see together how NEXQT can support you.
Your custom diagnosis
Let's discuss your project: in 30 minutes, let's see together how NEXQT can support you.
Where does our data come from?
Robust, representative data for the territory, sourced from vehicles
NEXQT then calibrates this FCD data using a physical traffic model and a machine learning algorithm, validated against reference permanent traffic counters.
NEXQT uses FCD (Floating Car Data):
Anonymized GPS signals continuously transmitted by connected vehicles traveling on your network. Each vehicle transmits its position and speed, allowing us to reconstruct actual traffic flows without installing any sensors.
+30 car manufacturers
These data aggregate signals from more than 30 automotive and truck manufacturers (Renault, VW, Toyota, etc.), including European, American, and Asian brands. In France, this represents several billion GPS traces per year, covering the entire road network.
The result is reliable data, quantified segment by segment, with a methodology published in leading international scientific journals. The data is anonymized and the processing is compliant with GDPR.

Where does our data come from?
Robust, representative data for the territory, sourced from vehicles
NEXQT then calibrates this FCD data using a physical traffic model and a machine learning algorithm, validated against reference permanent traffic counters.
NEXQT uses FCD (Floating Car Data):
Anonymized GPS signals continuously transmitted by connected vehicles traveling on your network. Each vehicle transmits its position and speed, allowing us to reconstruct actual traffic flows without installing any sensors.
+30 car manufacturers
These data aggregate signals from more than 30 automotive and truck manufacturers (Renault, VW, Toyota, etc.), including European, American, and Asian brands. In France, this represents several billion GPS traces per year, covering the entire road network.
The result is reliable data, quantified segment by segment, with a methodology published in leading international scientific journals. The data is anonymized and the processing is compliant with GDPR.

Where does our data come from?
Robust, representative data for the territory, sourced from vehicles
NEXQT then calibrates this FCD data using a physical traffic model and a machine learning algorithm, validated against reference permanent traffic counters.
NEXQT uses FCD (Floating Car Data):
Anonymized GPS signals continuously transmitted by connected vehicles traveling on your network. Each vehicle transmits its position and speed, allowing us to reconstruct actual traffic flows without installing any sensors.
+30 car manufacturers
These data aggregate signals from more than 30 automotive and truck manufacturers (Renault, VW, Toyota, etc.), including European, American, and Asian brands. In France, this represents several billion GPS traces per year, covering the entire road network.
The result is reliable data, quantified segment by segment, with a methodology published in leading international scientific journals. The data is anonymized and the processing is compliant with GDPR.
Your benefits
Your benefits
What's in it for you
What's in it for you
What's in it for you
Significantly cheaper than a study
A counting campaign costs €5,000 to €10,000 per road, for a single location and a single moment.
Your teams, more autonomous
Training and support included. Your staff can produce their own analyses.
Always up-to-date data
Automatic monthly updates, with daily figures down to sub-hourly levels.
5 years of data available
No waiting or installation: five years of history for each segment, available from deployment.
Controlled quality of service
Construction site, diversion: measure the difference in travel times and justify a contract amendment to the AOM.
Significantly cheaper than a study
A counting campaign costs €5,000 to €10,000 per road, for a single location and a single moment.
Your teams, more autonomous
Training and support included. Your staff can produce their own analyses.
Always up-to-date data
Automatic monthly updates, with daily figures down to sub-hourly levels.
5 years of data available
No waiting or installation: five years of history for each segment, available from deployment.
Controlled quality of service
Construction site, diversion: measure the difference in travel times and justify a contract amendment to the AOM.
For whom?
For whom?
Designed for local authorities and businesses.
Designed for local authorities and businesses.
Designed for local authorities and businesses.
Trafic journalier sur tous vos axes,
5 ans d'historique
01
02
03
04
05
/03
Collectivités locales de toutes tailles et Départements
Territories of all sizes, from municipalities to Departments, both urban and rural, in France and Europe.
Local authorities and departments
Territories of all sizes, from municipalities to Departments, both urban and rural, in France and Europe.
Local authorities and departments
Territories of all sizes, from municipalities to Departments, both urban and rural, in France and Europe.
Transport Organising Authorities (AOM)
Observed traffic data across your entire area, to help decide on mobility plans and monitor their real effects.
Transport Organising Authorities (AOM)
Observed traffic data across your entire area, to help decide on mobility plans and monitor their real effects.
Businesses
Public transport network operators (buses, coaches) and logistics and freight transport companies: real travel times by road, direction, and time slot, and measurement of the impact of disruptions.
Businesses
Public transport network operators (buses, coaches) and logistics and freight transport companies: real travel times by road, direction, and time slot, and measurement of the impact of disruptions.
Use Cases
Use Cases
Use Cases
A platform serving all your departments.
A platform serving all your departments.
A platform serving all your departments.
"What is the real effect of this project on traffic?"
"What is the real effect of this project on traffic?"
Compare flows, speeds, and traffic shifts before and after a bypass, roundabout, or cycle path, road by road, over five years of history. You measure instead of estimating.
Compare flows, speeds, and traffic shifts before and after a bypass, roundabout, or cycle path, road by road, over five years of history. You measure instead of estimating.
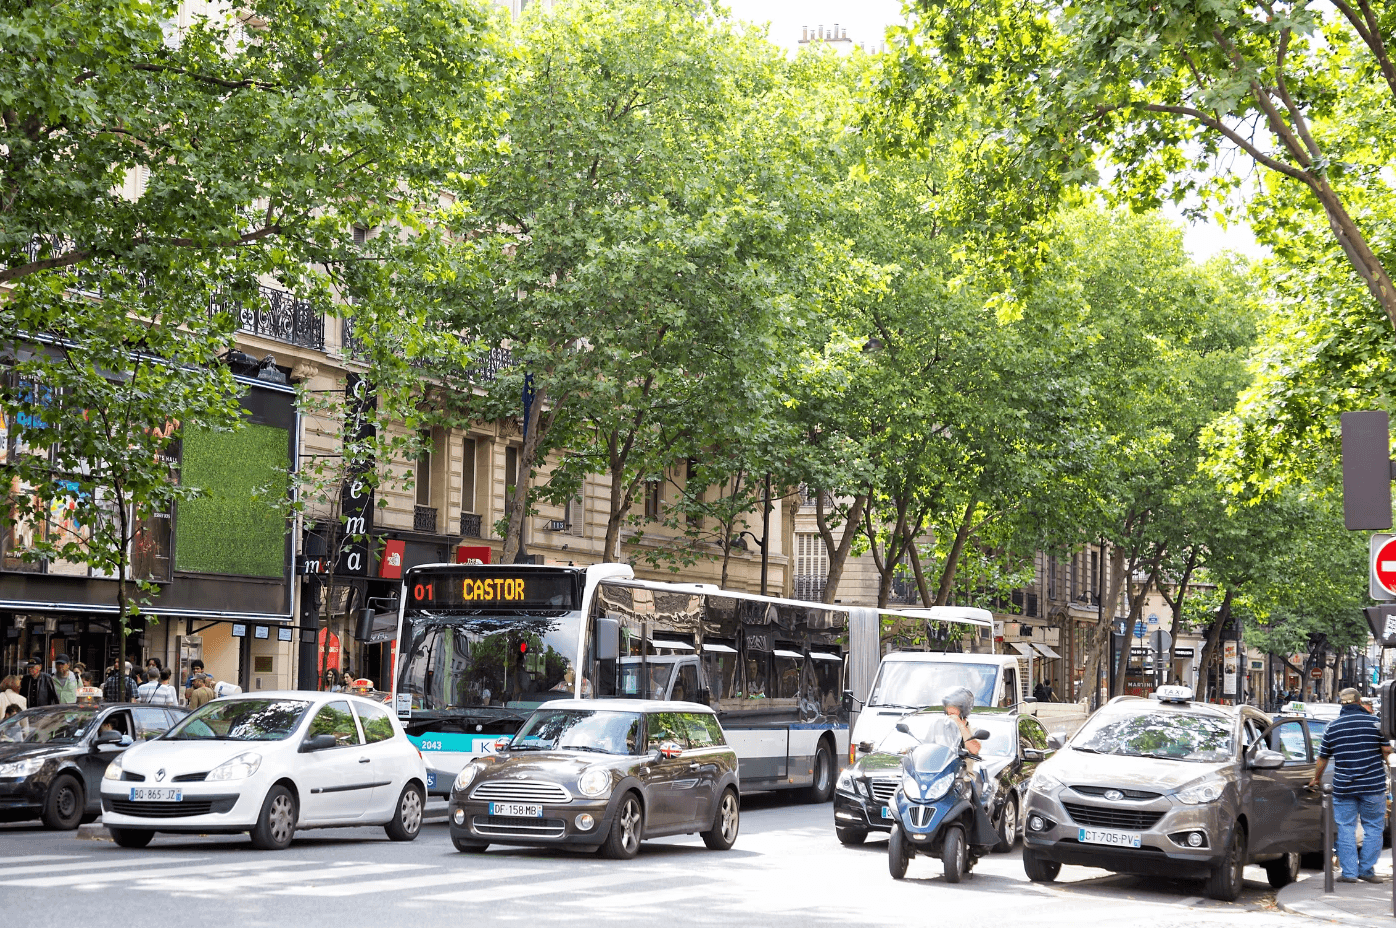
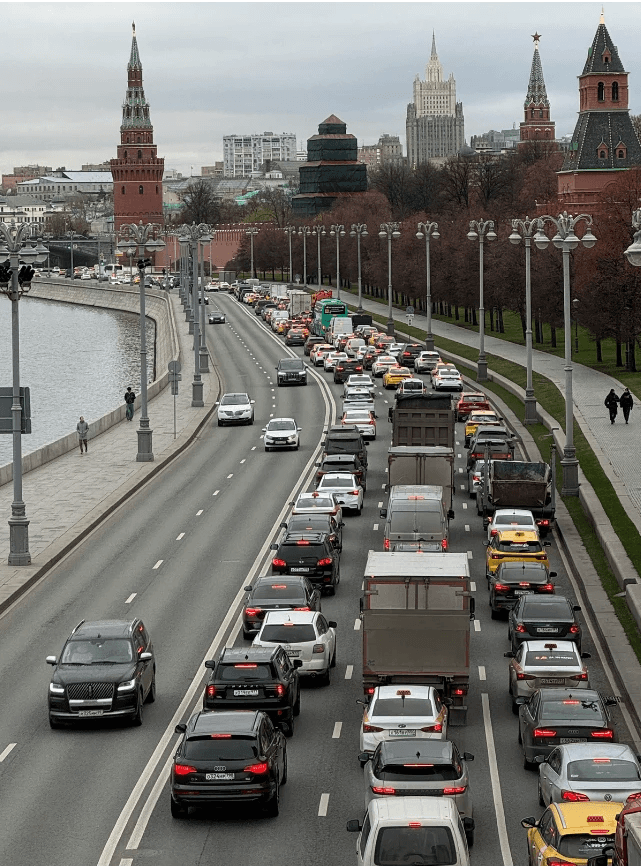

"Has my cycle path changed traffic flows in the neighborhood?"
"Where are speed limits not being respected?"
NEXQT provides actually observed speeds (V15, V85, average speed) for each segment. Compare them to current limits and identify roads with recurring speeding issues with citizens and elected officials.
"Has my cycle path changed traffic flows in the neighborhood?"
"What is the actual cost of this construction site to my lines?"
"What is the actual cost of this construction site to my lines?"
Bridge closure, diversion, long-term works: measure the difference in travel time, traffic shifts to alternative routes, and the actual duration of the effect. Concrete, sourced data to justify service adjustments, contract amendments, or compensation to the AOM.
Bridge closure, diversion, long-term works: measure the difference in travel time, traffic shifts to alternative routes, and the actual duration of the effect. Concrete, sourced data to justify service adjustments, contract amendments, or compensation to the AOM.
"Has my cycle path changed traffic flows in the neighborhood?"
"Has my cycle path changed traffic flows in the neighborhood?"
"Has my cycle path changed traffic flows in the neighborhood?"
Assess the impact of a cycling infrastructure project at the operation and neighborhood level, on both traffic and emissions. Concrete, quantified support for your Bike Plan.
Assess the impact of a cycling infrastructure project at the operation and neighborhood level, on both traffic and emissions. Concrete, quantified support for your Bike Plan.
"Has my cycle path changed traffic flows in the neighborhood?"
"Has my cycle path changed traffic flows in the neighborhood?"
"On which data should I base my travel times?"
"On which data should I base my travel times?"
NEXQT reports the speeds actually observed by segment, by direction and by time slot, and reconstructs travel times along your routes. You build your service design and your punctuality commitments on measured data, not on the outgoing operator's figures.
NEXQT reports the speeds actually observed by segment, by direction and by time slot, and reconstructs travel times along your routes. You build your service design and your punctuality commitments on measured data, not on the outgoing operator's figures.
"How can I feed and monitor my mobility plan?"
"How can I feed and monitor my mobility plan?"
Get a full network diagnosis by road hierarchy: congestion points, roads with recurring heavy traffic, zones with excessive speed.
Get a full network diagnosis by road hierarchy: congestion points, roads with recurring heavy traffic, zones with excessive speed.
"Has my cycle path changed traffic flows in the neighborhood?"
In practice
Un exemple
Un exemple
The redevelopment of Rue du Général Leclerc
The redevelopment of Rue du Général Leclerc
The redevelopment of Rue du Général Leclerc
In Le Kremlin-Bicêtre, how do you measure the real effect of a 3-meter two-way bike lane and the removal of 25 parking spaces, on the street itself and on the surrounding neighborhood?
In Le Kremlin-Bicêtre, how do you measure the real effect of a 3-meter two-way bike lane and the removal of 25 parking spaces, on the street itself and on the surrounding neighborhood?
In Le Kremlin-Bicêtre, how do you measure the real effect of a 3-meter two-way bike lane and the removal of 25 parking spaces, on the street itself and on the surrounding neighborhood?

The context
Avant l’aménagement, la rue était bordée de stationnement continu. Après, une piste cyclable bidirectionnelle a pris place.
02.
The method
03.
The results
04.
The use

The context
Une collectivité devait orienter un fonds de rénovation de plusieurs millions d'euros sur son parc de logements sociaux. La question : quels bâtiments traiter en premier, sur quels critères objectifs ?
The method
En quelques clics, l’agent sélectionne la zone d’impact sur la carte, puis compare le trafic et les vitesses avant et après l’aménagement, tronçon par tronçon, sur la période.

The results
52 % de trafic en moins sur l’axe aménagé et 13 % en moins sur la zone d’impact élargie, entre 2022 et 2025. Des chiffres factuels, exportables et vérifiables.

The use
Objectiver le dialogue avec les riverains, les élus et les partenaires : répondre aux interrogations sur des données réelles plutôt que sur des impressions.
Your custom diagnosis
Let's discuss your project: in 30 minutes, let's see together how NEXQT can support you.
Your custom diagnosis
Let's discuss your project: in 30 minutes, let's see together how NEXQT can support you.
Your custom diagnosis
Let's discuss your project: in 30 minutes, let's see together how NEXQT can support you.
Your custom diagnosis
Let's discuss your project: in 30 minutes, let's see together how NEXQT can support you.
Read also
Read also
Read also
Mobility News
Mobility News
Mobility News

NEWS
🚗 Saint-Cloud chooses NEXQT to guide sustainable mobility through data.
🚗 Saint-Cloud chooses NEXQT to guide sustainable mobility through data.

NEWS
🎯 We'll be waiting for you this Saturday, June 13, at NIDA in Issy-les-Moulineaux!
🎯 We'll be waiting for you this Saturday, June 13, at NIDA in Issy-les-Moulineaux!

NEWS