
Know where to act, decide with confidence,
building by building
No sensors, no on-site data collection: NEXQT reconstructs the energy-carbon digital twin of your buildings, at the scale of an entire territory or a real estate portfolio, and gives your teams the data to prioritize renovations, target funding, and meet your regulatory obligations.


For local authorities and businesses
5 years of history across your entire portfolio
Continuously updated data
Residential, private-sector and public-sector
Referenced solution






Measure traffic, speeds and emissions across your entire road network
NEXQT reconstructs real traffic flows on your network using GPS data from the vehicles traveling on it. No sensors to install, no counting campaigns: your teams have the data they need from day one.
For local authorities and businesses
Daily data with 5 years of history
Entire road network across all territories
Passenger cars, light commercial vehicles, and heavy goods vehicles
Passenger cars, light commercial vehicles, and heavy goods vehicles
Referenced solution

Know where to act, decide with confidence,
building by building
No sensors, no on-site data collection: NEXQT reconstructs the energy-carbon digital twin of your buildings, at the scale of an entire territory or a real estate portfolio, and gives your teams the data to prioritize renovations, target funding, and meet your regulatory obligations.
Pour les collectivités et les entreprises
5 years of history across your entire portfolio
Continuously updated data
Residential, private-sector and public-sector
Bâtiments logement et tertiaire
Solution référencée

For local authorities and businesses
5 years of history across your entire portfolio
Continuously updated data
Residential, private-sector and public-sector
Referenced solution
Deployed across more than 70 territories
Deployed across more than 70 territories



The Challenge
The Challenge
Your decisions are based on traffic data that is outdated, incomplete, and expensive to obtain.
You have to act across your entire portfolio, yet only a handful of buildings are documented
You have to act across your entire portfolio, yet only a handful of buildings are documented
Without continuous measurement, the real evolution of traffic flows remains invisible due to an information gap: new transit routes, the effects of a new development, drift in travel times. NEXQT reconstructs this data across your entire road network.
Energy poverty, district heating, tertiary decree, extra-financial reporting: your obligations cover an entire territory or a portfolio of hundreds or thousands of sites, but the data stops at aggregated averages or a few scattered assessments. Between a single building's EPC and a consolidated report, the scale needed to make decisions is missing. NEXQT reconstructs it: every building, its consumption, its emissions, its potential.
Energy poverty, district heating, tertiary decree, extra-financial reporting: your obligations cover an entire territory or a portfolio of hundreds or thousands of sites, but the data stops at aggregated averages or a few scattered assessments. Between a single building's EPC and a consolidated report, the scale needed to make decisions is missing. NEXQT reconstructs it: every building, its consumption, its emissions, its potential.
Deployed across more than 70 territories
Traffic, speed, and emissions data for your entire road network
No sensors to install, no costly measurement campaigns: NEXQT delivers the digital twin of your road network and gives your teams the data they need to manage mobility.

Know where to act, decide with confidence,
building by building
No sensors, no on-site data collection: NEXQT reconstructs the energy-carbon digital twin of your buildings, at the scale of an entire territory or a real estate portfolio, and gives your teams the data to prioritize renovations, target funding, and meet your regulatory obligations.

Traffic, speed, and emissions data for your entire road network
No sensors to install, no costly measurement campaigns: NEXQT delivers the digital twin of your road network and gives your teams the data they need to manage mobility.
Know where to act, decide with confidence,
building by building
No sensors, no on-site data collection: NEXQT reconstructs the energy-carbon digital twin of your buildings, at the scale of an entire territory or a real estate portfolio, and gives your teams the data to prioritize renovations, target funding, and meet your regulatory obligations.
With NEXQT
The digital twin of your building portfolio
The digital twin of your building portfolio

Full network coverage, without physical sensors
Every building covered, residential and tertiary alike, with no sensor or on-site collection
Every building covered, residential and tertiary alike, with no sensor or on-site collection
Traffic, speeds, and emissions for all vehicle types
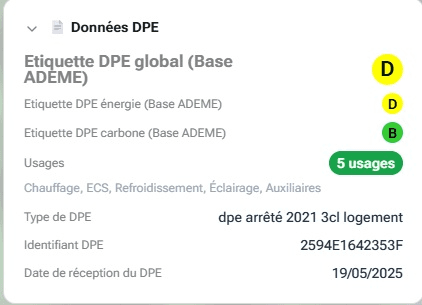
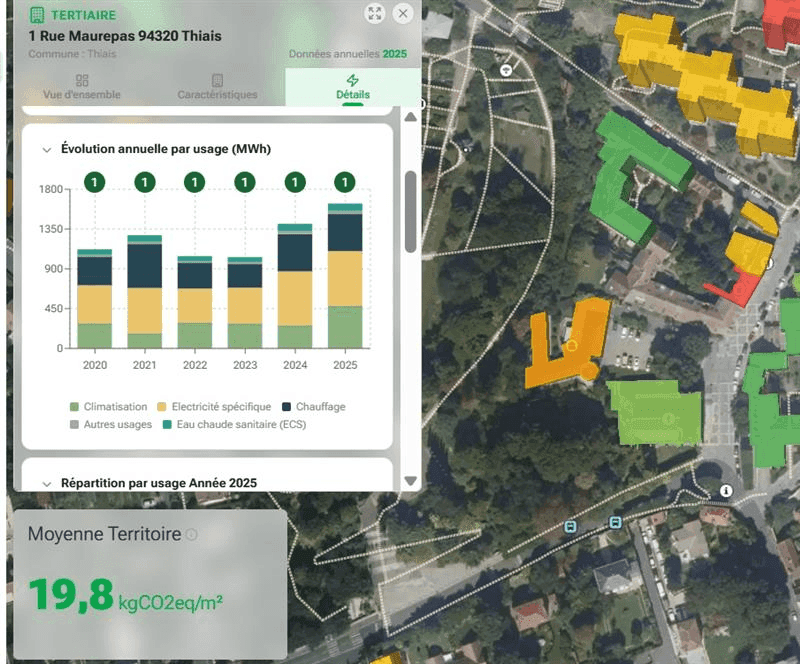
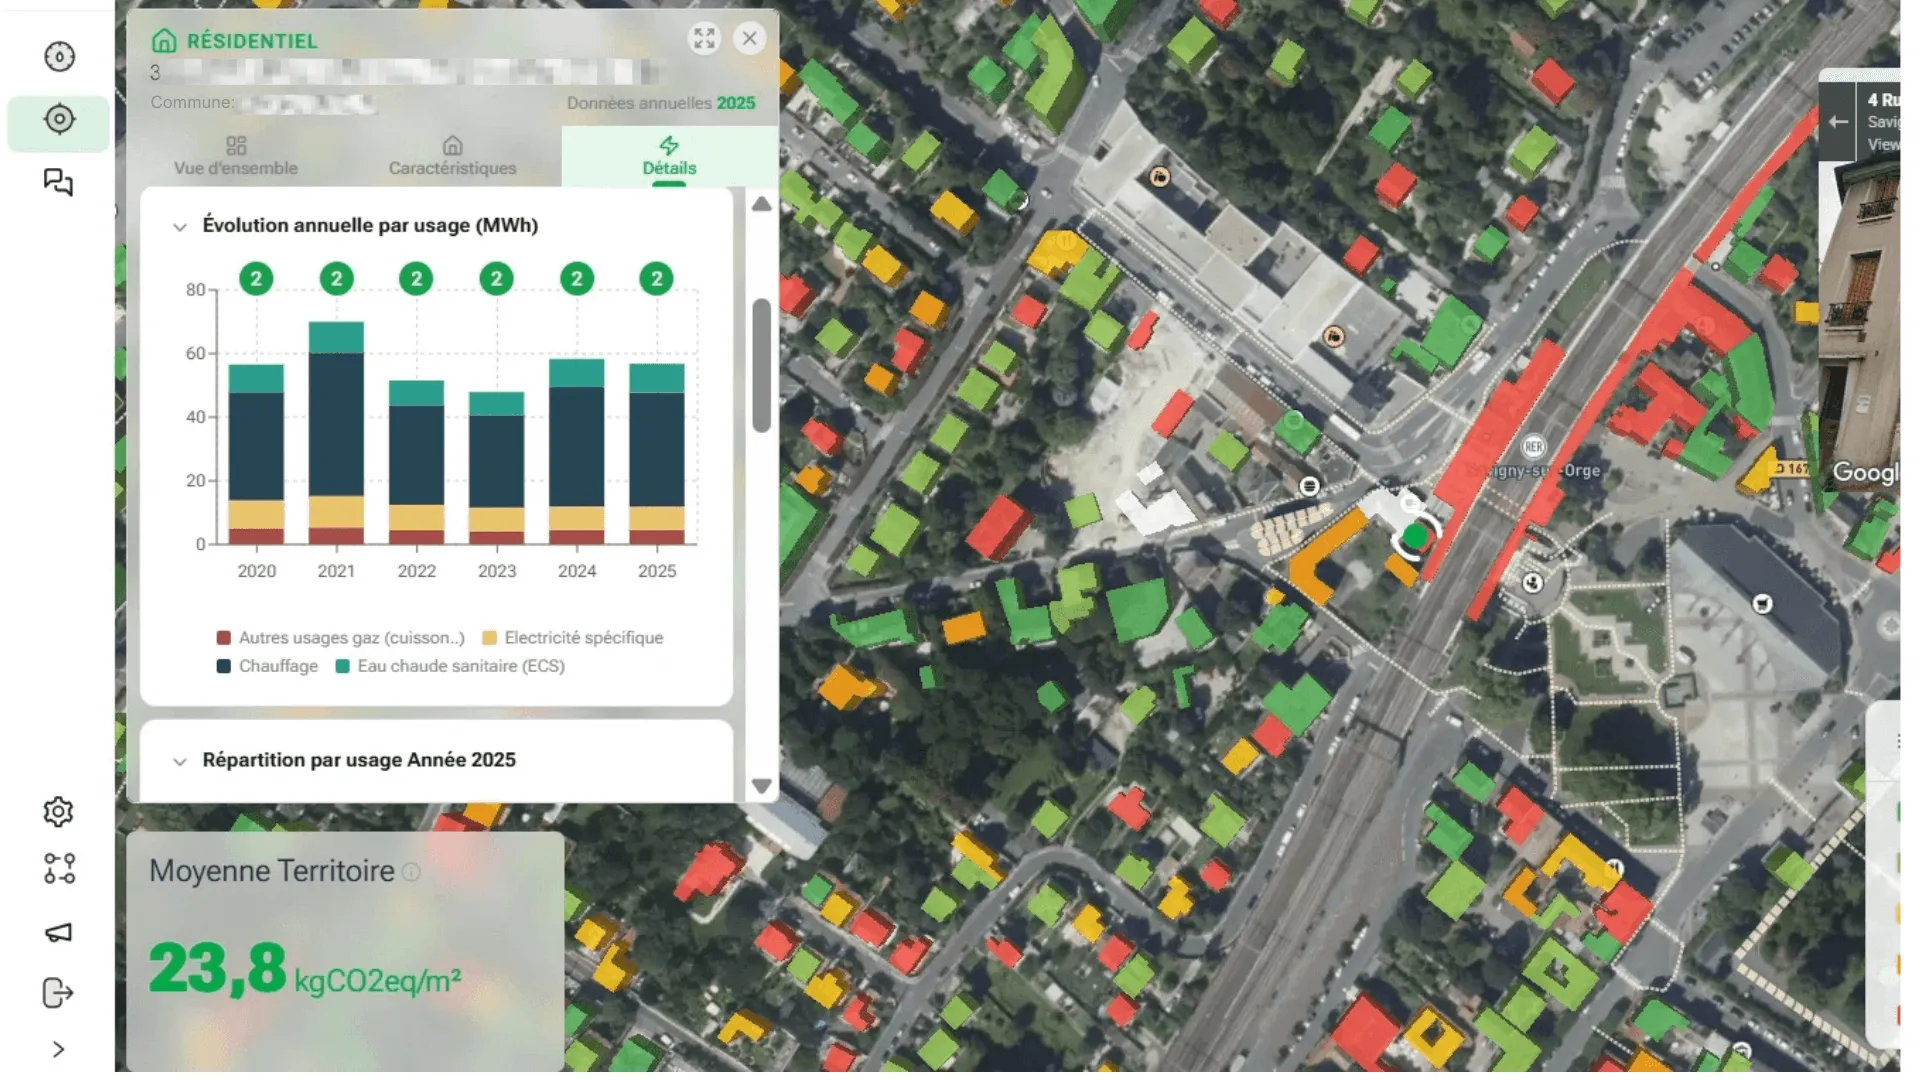
Consumption, EPC, emissions, renewable-energy potential and summer overheating, building by building
Consumption, EPC, emissions, renewable-energy potential and summer overheating, building by building
Segment by segment, day by day, over five years of history
Three scales (territory, neighborhood, building) with five years of history and monthly updates
Three scales (territory, neighborhood, building) with five years of history and monthly updates
Multi-criteria targeting to know where to act: district-heating connection, energy poverty, tertiary-decree liability
Multi-criteria targeting to know where to act: district-heating connection, energy poverty, tertiary-decree liability
Multi-criteria targeting to know where to act: district-heating connection, energy poverty, tertiary-decree liability
Multi-criteria targeting to know where to act: district-heating connection, energy poverty, tertiary-decree liability
A simple interface, accessible without technical expertise to all departments: roadworks, road safety, line operations, energy transition
02

100% of your network covered

02

Traffic speed emissions
03

Section by section
01
Energy data
02
5 years of history
03

Energy potential
01
Energy data
02
5 years of history
03
Energy potential
With NEXQT
The digital twin of your network
The digital twin of your network
The digital twin of your network

Measurements limited to a few roads and a few days leave an information gap
Costly one-off audits on your portfolio, when the budget allows
Costly one-off audits on your portfolio, when the budget allows

Averages at the municipality or IRIS level, never the building
Averages at the municipality or IRIS level, never the building
Averages at the municipality or IRIS level, never the building

Data scattered across public sources, departments, and providers
Data scattered across public sources, departments, and providers
Data scattered across public sources, departments, and providers
No consolidated view to compare buildings with one another
No consolidated view to compare buildings with one another
No consolidated view to compare buildings with one another
Trade-offs that are hard to justify to elected officials and funders
Trade-offs that are hard to justify to elected officials and funders
Trade-offs that are hard to justify to elected officials and funders
The Challenge
You have to act across your entire portfolio, yet only a handful of buildings are documented
Energy poverty, district heating, tertiary decree, extra-financial reporting: your obligations cover an entire territory or a portfolio of hundreds or thousands of sites, but the data stops at aggregated averages or a few scattered assessments. Between a single building's EPC and a consolidated report, the scale needed to make decisions is missing. NEXQT reconstructs it: every building, its consumption, its emissions, its potential.
Without NEXQT
A partial, quickly outdated inventory
Costly one-off audits on your portfolio, when the budget allows
Averages at the municipality or IRIS level, never the building
Data scattered across public sources, departments, and providers
No consolidated view to compare buildings with one another
Trade-offs that are hard to justify to elected officials and funders
With NEXQT
The digital twin of your building portfolio
Every building covered, residential and tertiary alike, with no sensor or on-site collection
Consumption, EPC, emissions, renewable-energy potential and summer overheating, building by building
Three scales (territory, neighborhood, building) with five years of history and monthly updates
Multi-criteria targeting to know where to act: district-heating connection, energy poverty, tertiary-decree liability
A simple interface, accessible without technical expertise to all departments: roadworks, road safety, line operations, energy transition
01

Energy data
02

03
Where does our data come from?
Several dozen sources, aggregated building by building

Thermal modeling
Where information is missing, a physical model of the building stock and machine-learning algorithms reconstruct the missing data, calibrated on the actual consumption observed nearby.
Dozens of sources, matched building by building
NEXQT automatically aggregates dozens of official databases (Enedis, GRDF, EPC ADEME, land registry, Land Files, FINESS…). A geomatching engine links each record to the right building, at the address and land-parcel level.

Where does our data come from?
Several dozen sources, aggregated building by building


Published and verifiable reliability
The result is reliable data, quantified segment by segment, with a methodology published in leading international scientific journals. The data is anonymized and the processing is compliant with GDPR.
Dozens of sources, matched building by building
NEXQT automatically aggregates dozens of official databases (Enedis, GRDF, EPC ADEME, land registry, Land Files, FINESS…). A geomatching engine links each record to the right building, at the address and land-parcel level.
Thermal modeling
Where information is missing, a physical model of the building stock and machine-learning algorithms reconstruct the missing data, calibrated on the actual consumption observed nearby.
A confidence index on every data point
Each value is labeled according to its origin: meter reading, existing EPC, or reconstruction. You always know what you are looking at, and with what level of reliability. Data is processed in compliance with the GDPR, with no personal information.
Modélisation là où la donnée manque
Là où l'information est absente, un modèle physique du bâti et des algorithmes d'apprentissage reconstituent la donnée manquante, calibrés sur les consommations réelles observées à proximité.
Un indice de confiance sur chaque donnée
Chaque valeur est labellisée selon son origine : relevé compteur, DPE existant ou reconstitution. Vous savez toujours ce que vous regardez, et avec quel niveau de fiabilité. Les données sont traitées dans le respect du RGPD, sans aucune information nominative.
Des dizaines de sources, rapprochées bâtiment par bâtiment
NEXQT agrège automatiquement des dizaines de bases officielles (Enedis, GRDF, DPE ADEME, cadastre, Fichier Foncier, FINESS…). Un moteur de geomatching rattache chaque enregistrement au bon bâtiment, à l'adresse et à l'unité foncière.
Modélisation là où la donnée manque
Là où l'information est absente, un modèle physique du bâti et des algorithmes d'apprentissage reconstituent la donnée manquante, calibrés sur les consommations réelles observées à proximité.
Un indice de confiance sur chaque donnée
Chaque valeur est labellisée selon son origine : relevé compteur, DPE existant ou reconstitution. Vous savez toujours ce que vous regardez, et avec quel niveau de fiabilité. Les données sont traitées dans le respect du RGPD, sans aucune information nominative.
Des dizaines de sources, rapprochées bâtiment par bâtiment
NEXQT agrège automatiquement des dizaines de bases officielles (Enedis, GRDF, DPE ADEME, cadastre, Fichier Foncier, FINESS…). Un moteur de geomatching rattache chaque enregistrement au bon bâtiment, à l'adresse et à l'unité foncière.

Far cheaper than an audit
An energy audit is done building by building. NEXQT covers your entire portfolio for a flat fee, from a few dozen to several thousand buildings.

More self-sufficient teams
Training and support included. Your teams produce their own analyses without turning to an energy-planning consultancy every time.

Always up-to-date data
Automatic monthly updates. No frozen snapshot to redo for every study.

Prioritize on your own criteria
Multi-criteria scoring ranks your buildings by what matters to you: EPC, energy poverty, overheating, fossil energy, energy-savings-certificate potential…

Better-prepared funding applications
Fonds Vert, energy-savings certificates (CEE), Fonds Chaleur, ADEME programs: sourced, building-level figures to qualify your projects and support your applications.
Your benefits
What you gain
Full portfolio coverage
Every building covered
From the single-family home to the tertiary establishment, each type is handled with the indicators that fit it.

Residential
Single-family homes, large and small condominiums, social housing. For each property: EPC, consumption, exposure to summer overheating, energy poverty, renovation and decarbonization potential.

Tertiary
Public administration, offices, retail, cafés-hotels-restaurants, education, healthcare, transport, sports-culture-leisure, communal housing. For each establishment: consumption and emissions by use, status under the tertiary decree, renewable-energy and renovation potential.
For whom?
Built for local authorities and asset managers
In every case, the same value: a reliable view of energy-carbon performance, support for compliance (tertiary decree, BACS, CEE…), and a data-backed basis to carry weight with funders.
01
02
03
04
05
/03

Local authorities and departments
Territories of all sizes, from the municipality to the metropolis, urban and rural alike, in France and across Europe.
Businesses and asset managers
Companies, social landlords, and operators managing an extensive real estate portfolio: consumption, regulatory compliance, and renovation prioritization across all their sites.
Federations and network heads
For professional organizations such as those in the social, medical-social, healthcare, or leisure sectors, whose members each operate their own facilities: characterize the network's portfolio without collecting anything from members, and carry weight in the dialogue with funders.
Use Cases
A platform serving your decisions
"Which buildings should I connect to decarbonize heating?"
Detect connectable buildings on energy and techno-economic criteria, to arbitrate between densifying, extending, and creating a network.

"Where do my obligations lie, and where do I start?"
Qualify liable buildings and track their energy performance over time, at the scale of a single site or an entire portfolio.

"Where are the vulnerable households?"
Get a full network diagnosis by road hierarchy: congestion points, roads with recurring heavy traffic, zones with excessive speed.

"Which building do I start with?"
Rank your buildings by the criteria that matter to you: EPC, fossil energy, overheating, savings potential, and get a shared, adjustable priority order.

"How do I feed my PLUi, my PLH, my climate plan?"
Get precise information at the neighborhood, municipal, or metropolitan scale to support your planning documents.

"How do I qualify my projects for funders?"
Access the asset data required by Fonds Vert, CEE, and ADEME programs, and quantify the mobilizable potential before submitting an application.

"What solar, geothermal, or heat-pump potential?"
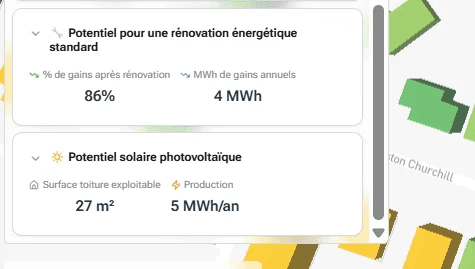
Estimate renewable-energy potential building by building, to guide your decarbonization investments.
An example
Prioritizing a renovation fund across the social-housing stock
In Le Kremlin-Bicêtre, how do you measure the real effect of a 3-meter two-way bike lane and the removal of 25 parking spaces, on the street itself and on the surrounding neighborhood?
01.

The context

The method
NEXQT built a scoring model combining six weightable criteria: EPC, energy poverty, summer overheating, distance to the district-heating network, solar potential, and heat-pump relevance. The thresholds and weightings were set with the local teams.
03.
The results
04.

L'usage
The context
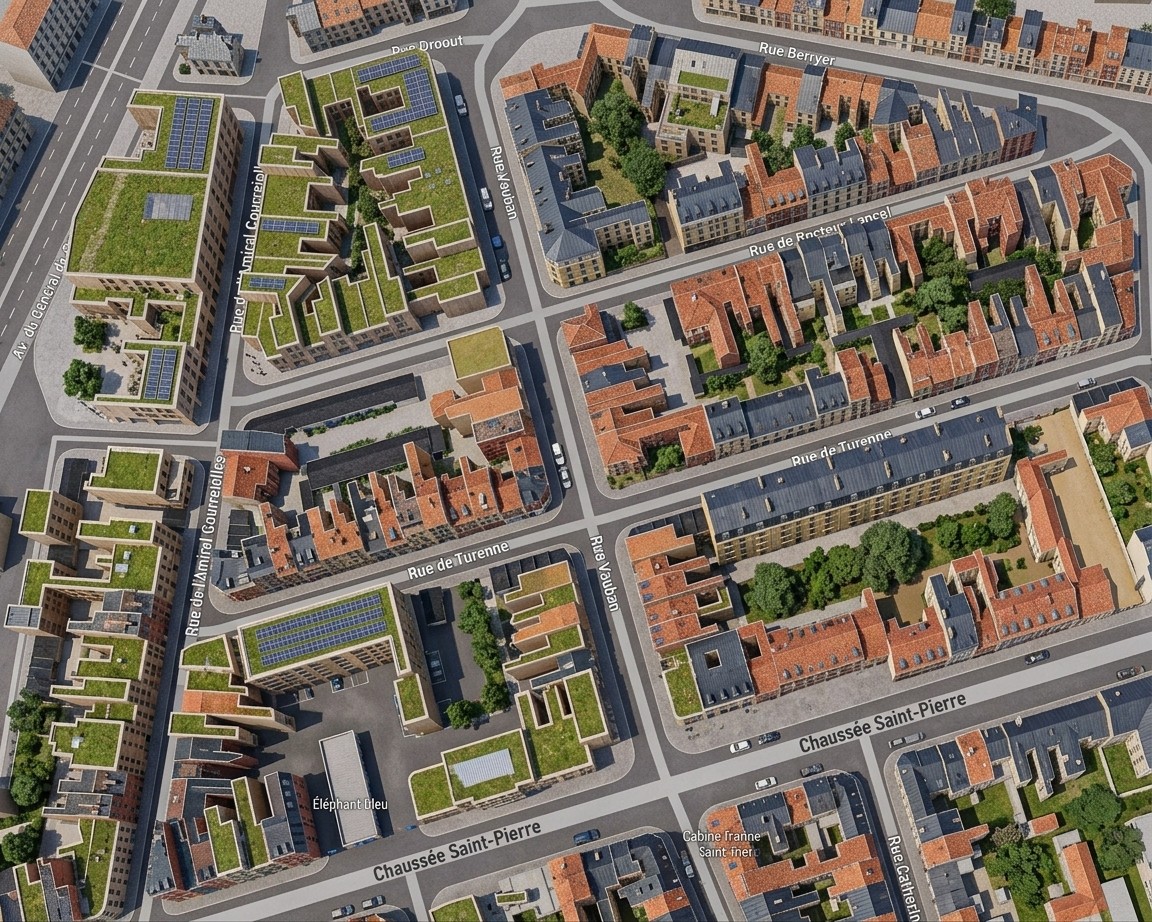
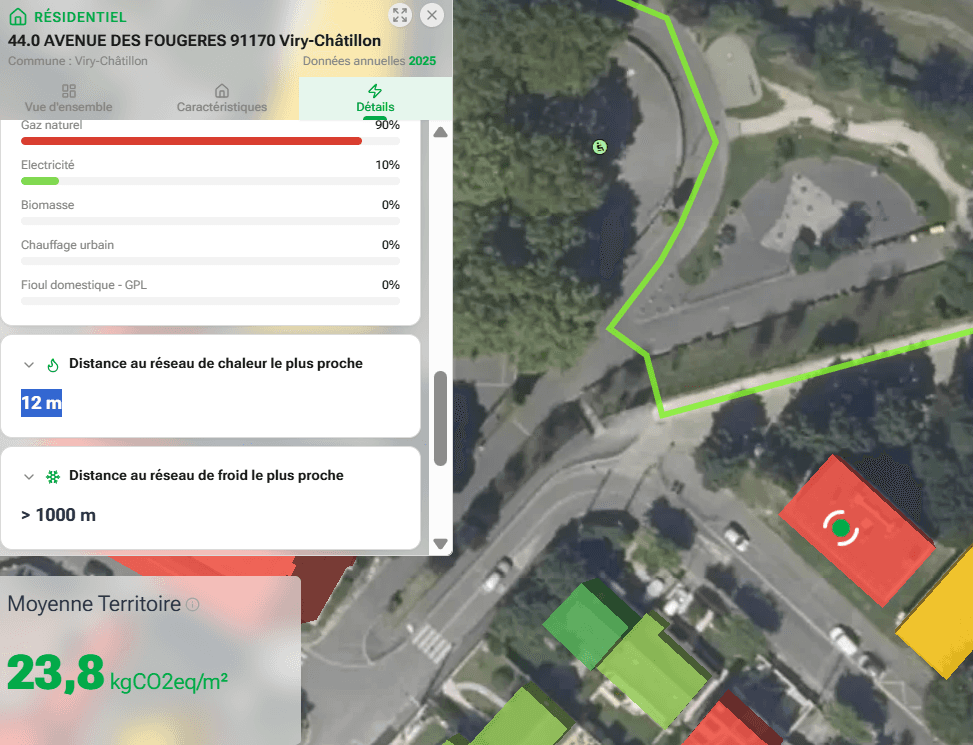
The Public Territorial Establishment (EPT) needed to direct a renovation fund toward the most critical buildings in its social-housing stock. With no comparable data from one landlord to the next, decisions relied on inconsistent files and self-declared priorities.
The method
NEXQT built a scoring model combining six weightable criteria: EPC, energy poverty, summer overheating, distance to the district-heating network, solar potential, and heat-pump relevance. The thresholds and weightings were set with the local teams.

The results
14 buildings in top priority, i.e. 1,761 dwellings, and 518 in high priority, i.e. 21,530 dwellings, out of the 114,321 in the stock. A shared, adjustable, and defensible ranking that directs investment based on facts rather than impressions.
The use
The same dataset serves beyond the fund: by combining consumption, energies to be replaced, and distance to the existing network, the territory identifies its connectable buildings and quantifies a densification or extension potential for its master plan.
Your custom diagnosis
Let's discuss your project: in 30 minutes, let's see together how NEXQT can support you.
Your custom diagnosis
Let's discuss your project: in 30 minutes, let's see together how NEXQT can support you.
Where does our data come from?
Several dozen sources, aggregated building by building
Thermal modeling
Where information is missing, a physical model of the building stock and machine-learning algorithms reconstruct the missing data, calibrated on the actual consumption observed nearby.
Dozens of sources, matched building by building
NEXQT automatically aggregates dozens of official databases (Enedis, GRDF, EPC ADEME, land registry, Land Files, FINESS…). A geomatching engine links each record to the right building, at the address and land-parcel level.
A confidence index on every data point
Each value is labeled according to its origin: meter reading, existing EPC, or reconstruction. You always know what you are looking at, and with what level of reliability. Data is processed in compliance with the GDPR, with no personal information.
A confidence index on every data point
Each value is labeled according to its origin: meter reading, existing EPC, or reconstruction. You always know what you are looking at, and with what level of reliability. Data is processed in compliance with the GDPR, with no personal information.

Where does our data come from?
Several dozen sources, aggregated building by building
Thermal modeling
Where information is missing, a physical model of the building stock and machine-learning algorithms reconstruct the missing data, calibrated on the actual consumption observed nearby.
Dozens of sources, matched building by building
NEXQT automatically aggregates dozens of official databases (Enedis, GRDF, EPC ADEME, land registry, Land Files, FINESS…). A geomatching engine links each record to the right building, at the address and land-parcel level.
A confidence index on every data point
Each value is labeled according to its origin: meter reading, existing EPC, or reconstruction. You always know what you are looking at, and with what level of reliability. Data is processed in compliance with the GDPR, with no personal information.
A confidence index on every data point
Each value is labeled according to its origin: meter reading, existing EPC, or reconstruction. You always know what you are looking at, and with what level of reliability. Data is processed in compliance with the GDPR, with no personal information.

Where does our data come from?
Several dozen sources, aggregated building by building
Thermal modeling
Where information is missing, a physical model of the building stock and machine-learning algorithms reconstruct the missing data, calibrated on the actual consumption observed nearby.
Dozens of sources, matched building by building
NEXQT automatically aggregates dozens of official databases (Enedis, GRDF, EPC ADEME, land registry, Land Files, FINESS…). A geomatching engine links each record to the right building, at the address and land-parcel level.
A confidence index on every data point
Each value is labeled according to its origin: meter reading, existing EPC, or reconstruction. You always know what you are looking at, and with what level of reliability. Data is processed in compliance with the GDPR, with no personal information.
A confidence index on every data point
Each value is labeled according to its origin: meter reading, existing EPC, or reconstruction. You always know what you are looking at, and with what level of reliability. Data is processed in compliance with the GDPR, with no personal information.
Your benefits
Your benefits
What's in it for you
What's in it for you
What's in it for you
Far cheaper than an audit
An energy audit is done building by building. NEXQT covers your entire portfolio for a flat fee, from a few dozen to several thousand buildings.
More self-sufficient teams
Training and support included. Your teams produce their own analyses without turning to an energy-planning consultancy every time.
Prioritize on your own criteria
Multi-criteria scoring ranks your buildings by what matters to you: EPC, energy poverty, overheating, fossil energy, energy-savings-certificate potential…
Always up-to-date data
Automatic monthly updates. No frozen snapshot to redo for every study.

Better-prepared funding applications
Fonds Vert, energy-savings certificates (CEE), Fonds Chaleur, ADEME programs: sourced, building-level figures to qualify your projects and support your applications.
Better-prepared funding applications
Fonds Vert, energy-savings certificates (CEE), Fonds Chaleur, ADEME programs: sourced, building-level figures to qualify your projects and support your applications.
Far cheaper than an audit
Un audit énergétique se fait bâtiment par bâtiment. NEXQT couvre tout votre parc pour un forfait, de quelques dizaines à plusieurs milliers de bâtiments.
More self-sufficient teams
Training and support included. Your teams produce their own analyses without turning to an energy-planning consultancy every time.
Prioritize on your own criteria
Multi-criteria scoring ranks your buildings by what matters to you: EPC, energy poverty, overheating, fossil energy, energy-savings-certificate potential…
Always up-to-date data
Un scoring multicritères classe vos bâtiments selon les critères qui comptent pour vous : DPE, précarité, surchauffe, énergie fossile, potentiel CEE..
5 years of data available
No waiting or installation: five years of history for each segment, available from deployment.
5 years of data available
No waiting or installation: five years of history for each segment, available from deployment.
Better-prepared funding applications
Fonds Vert, energy-savings certificates (CEE), Fonds Chaleur, ADEME programs: sourced, building-level figures to qualify your projects and support your applications.
Better-prepared funding applications
Fonds Vert, energy-savings certificates (CEE), Fonds Chaleur, ADEME programs: sourced, building-level figures to qualify your projects and support your applications.
For whom?
For whom?
Designed for local authorities and businesses.
Built for local authorities and asset managers
Built for local authorities and asset managers
Without continuous measurement, the real evolution of traffic flows remains invisible due to an information gap: new transit routes, the effects of a new development, drift in travel times. NEXQT reconstructs this data across your entire road network.
In every case, the same value: a reliable view of energy-carbon performance, support for compliance (tertiary decree, BACS, CEE…), and a data-backed basis to carry weight with funders.
Trafic journalier sur tous vos axes,
5 ans d'historique
01
02
03
04
05
/03
Collectivités locales de toutes tailles et Départements
Territories of all sizes, from municipalities to Departments, both urban and rural, in France and Europe.
Local authorities and departments
In every case, the same value: a reliable view of energy-carbon performance, support for compliance (tertiary decree, BACS, CEE…), and a data-backed basis to carry weight with funders.
Local authorities and departments
In every case, the same value: a reliable view of energy-carbon performance, support for compliance (tertiary decree, BACS, CEE…), and a data-backed basis to carry weight with funders.
Transport Organising Authorities (AOM)
Observed traffic data across your entire area, to help decide on mobility plans and monitor their real effects.
Businesses and asset managers
Companies, social landlords, and operators managing an extensive real estate portfolio: consumption, regulatory compliance, and renovation prioritization across all their sites.
Businesses and asset managers
Companies, social landlords, and operators managing an extensive real estate portfolio: consumption, regulatory compliance, and renovation prioritization across all their sites.
Businesses
Public transport network operators (buses, coaches) and logistics and freight transport companies: real travel times by road, direction, and time slot, and measurement of the impact of disruptions.
Federations and network heads
For professional organizations such as those in the social, medical-social, healthcare, or leisure sectors, whose members each operate their own facilities: characterize the network's portfolio without collecting anything from members, and carry weight in the dialogue with funders.
Federations and network heads
For professional organizations such as those in the social, medical-social, healthcare, or leisure sectors, whose members each operate their own facilities: characterize the network's portfolio without collecting anything from members, and carry weight in the dialogue with funders.
Full portfolio coverage
Every building covered
From the single-family home to the tertiary establishment, each type is handled with the indicators that fit it.
Residential
Single-family homes, large and small condominiums, social housing. For each property: EPC, consumption, exposure to summer overheating, energy poverty, renovation and decarbonization potential.
Residential
Single-family homes, large and small condominiums, social housing. For each property: EPC, consumption, exposure to summer overheating, energy poverty, renovation and decarbonization potential.
Tertiary
Public administration, offices, retail, cafés-hotels-restaurants, education, healthcare, transport, sports-culture-leisure, communal housing. For each establishment: consumption and emissions by use, status under the tertiary decree, renewable-energy and renovation potential.
Tertiary
Public administration, offices, retail, cafés-hotels-restaurants, education, healthcare, transport, sports-culture-leisure, communal housing. For each establishment: consumption and emissions by use, status under the tertiary decree, renewable-energy and renovation potential.
Use Cases
Use Cases
Use Cases
A platform serving your decisions
A platform serving your decisions
A platform serving your decisions
"What is the real effect of this project on traffic?"
"How do I qualify my projects for funders?"
"What solar, geothermal, or heat-pump potential?"
Compare flows, speeds, and traffic shifts before and after a bypass, roundabout, or cycle path, road by road, over five years of history. You measure instead of estimating.
Access the asset data required by Fonds Vert, CEE, and ADEME programs, and quantify the mobilizable potential before submitting an application.
Estimate renewable-energy potential building by building, to guide your decarbonization investments.


"Has my cycle path changed traffic flows in the neighborhood?"
Funding and CEE
Renewable-energy potential
"What is the real effect of this project on traffic?"
"What solar, geothermal, or heat-pump potential?"
Compare flows, speeds, and traffic shifts before and after a bypass, roundabout, or cycle path, road by road, over five years of history. You measure instead of estimating.
Estimate renewable-energy potential building by building, to guide your decarbonization investments.
Identify homes in energy poverty, in single-family houses or small condominiums, through analyses combining energy and socioeconomic data.


"Has my cycle path changed traffic flows in the neighborhood?"
Renewable-energy potential
Energy poverty
"Has my cycle path changed traffic flows in the neighborhood?"
Planning documents
Funding and CEE
"Where are speed limits not being respected?"
"How do I feed my PLUi, my PLH, my climate plan?"
"How do I qualify my projects for funders?"
NEXQT provides actually observed speeds (V15, V85, average speed) for each segment. Compare them to current limits and identify roads with recurring speeding issues with citizens and elected officials.
Get precise information at the neighborhood, municipal, or metropolitan scale to support your planning documents.
Access the asset data required by Fonds Vert, CEE, and ADEME programs, and quantify the mobilizable potential before submitting an application.


"What is the actual cost of this construction site to my lines?"
"Which building do I start with?"
"How do I feed my PLUi, my PLH, my climate plan?"
Bridge closure, diversion, long-term works: measure the difference in travel time, traffic shifts to alternative routes, and the actual duration of the effect. Concrete, sourced data to justify service adjustments, contract amendments, or compensation to the AOM.
Rank your buildings by the criteria that matter to you: EPC, fossil energy, overheating, savings potential, and get a shared, adjustable priority order.
Get precise information at the neighborhood, municipal, or metropolitan scale to support your planning documents.


"Has my cycle path changed traffic flows in the neighborhood?"
Renovation prioritization
Planning documents
District heating
District heating
"Which buildings should I connect to decarbonize heating?"
Assess the impact of a cycling infrastructure project at the operation and neighborhood level, on both traffic and emissions. Concrete, quantified support for your Bike Plan.
Detect connectable buildings on energy and techno-economic criteria, to arbitrate between densifying, extending, and creating a network.
Detect connectable buildings on energy and techno-economic criteria, to arbitrate between densifying, extending, and creating a network.


District heating
"On which data should I base my travel times?"
"Where do my obligations lie, and where do I start?"
"Where do my obligations lie, and where do I start?"
NEXQT reports the speeds actually observed by segment, by direction and by time slot, and reconstructs travel times along your routes. You build your service design and your punctuality commitments on measured data, not on the outgoing operator's figures.
Qualify liable buildings and track their energy performance over time, at the scale of a single site or an entire portfolio.
Qualify liable buildings and track their energy performance over time, at the scale of a single site or an entire portfolio.


"Has my cycle path changed traffic flows in the neighborhood?"
Tertiary decree
"How can I feed and monitor my mobility plan?"
"Where are the vulnerable households?"
"Which building do I start with?"
Get a full network diagnosis by road hierarchy: congestion points, roads with recurring heavy traffic, zones with excessive speed.
Identify homes in energy poverty, in single-family houses or small condominiums, through analyses combining energy and socioeconomic data.
Rank your buildings by the criteria that matter to you: EPC, fossil energy, overheating, savings potential, and get a shared, adjustable priority order.


"Has my cycle path changed traffic flows in the neighborhood?"
Energy poverty
Renovation prioritization
In practice
Un exemple
Un exemple
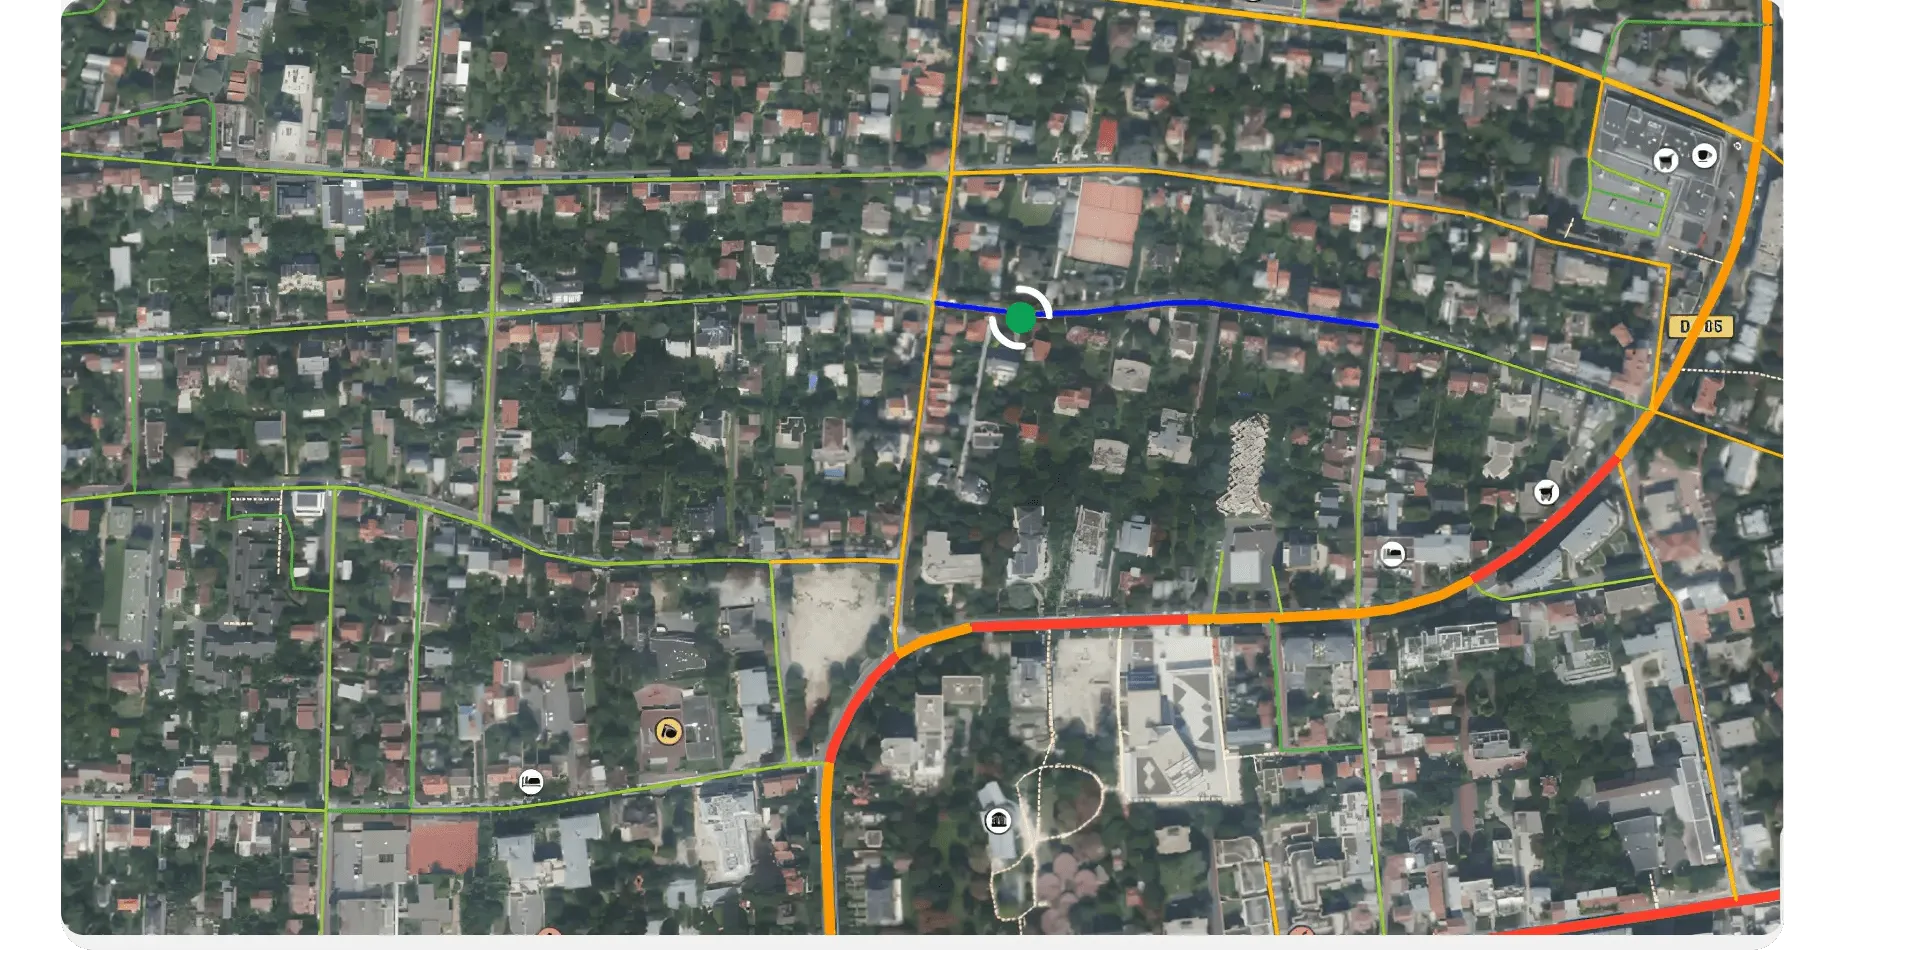
The redevelopment of Rue du Général Leclerc
Prioritizing a renovation fund across the social-housing stock
Prioritizing a renovation fund across the social-housing stock
In Le Kremlin-Bicêtre, how do you measure the real effect of a 3-meter two-way bike lane and the removal of 25 parking spaces, on the street itself and on the surrounding neighborhood?
For a Public Territorial Establishment (EPT) and its member municipalities, on what criteria and how should several million euros of renovation be allocated across 2,317 social-housing buildings?
For a Public Territorial Establishment (EPT) and its member municipalities, on what criteria and how should several million euros of renovation be allocated across 2,317 social-housing buildings?
In Le Kremlin-Bicêtre, how do you measure the real effect of a 3-meter two-way bike lane and the removal of 25 parking spaces, on the street itself and on the surrounding neighborhood?

The context
Avant l’aménagement, la rue était bordée de stationnement continu. Après, une piste cyclable bidirectionnelle a pris place.
02.
The method
03.
The results
04.
The use
The context
The Public Territorial Establishment (EPT) needed to direct a renovation fund toward the most critical buildings in its social-housing stock. With no comparable data from one landlord to the next, decisions relied on inconsistent files and self-declared priorities.
The method
NEXQT built a scoring model combining six weightable criteria: EPC, energy poverty, summer overheating, distance to the district-heating network, solar potential, and heat-pump relevance. The thresholds and weightings were set with the local teams.
The results
14 buildings in top priority, i.e. 1,761 dwellings, and 518 in high priority, i.e. 21,530 dwellings, out of the 114,321 in the stock. A shared, adjustable, and defensible ranking that directs investment based on facts rather than impressions.

The use
The same dataset serves beyond the fund: by combining consumption, energies to be replaced, and distance to the existing network, the territory identifies its connectable buildings and quantifies a densification or extension potential for its master plan.
The context
The Public Territorial Establishment (EPT) needed to direct a renovation fund toward the most critical buildings in its social-housing stock. With no comparable data from one landlord to the next, decisions relied on inconsistent files and self-declared priorities.
The method
NEXQT built a scoring model combining six weightable criteria: EPC, energy poverty, summer overheating, distance to the district-heating network, solar potential, and heat-pump relevance. The thresholds and weightings were set with the local teams.
The results
14 buildings in top priority, i.e. 1,761 dwellings, and 518 in high priority, i.e. 21,530 dwellings, out of the 114,321 in the stock. A shared, adjustable, and defensible ranking that directs investment based on facts rather than impressions.

The use
The same dataset serves beyond the fund: by combining consumption, energies to be replaced, and distance to the existing network, the territory identifies its connectable buildings and quantifies a densification or extension potential for its master plan.
Your custom diagnosis
Let's discuss your project: in 30 minutes, let's see together how NEXQT can support you.
Your custom diagnosis
Let's discuss your project: in 30 minutes, let's see together how NEXQT can support you.
Your custom diagnosis
Let's discuss your project: in 30 minutes, let's see together how NEXQT can support you.
Your custom diagnosis
Let's discuss your project: in 30 minutes, let's see together how NEXQT can support you.
Read also
Read also
Read also
Mobility News
Building news
Building news

ACTUALITÉ
📍 See you at the AMIF (Association des Maires d'Île-de-France) trade show next week!

ACTUALITÉ
The best way to support the transition of cities and private players? Set an example.

ACTUALITÉ
📢 We're waiting for you tomorrow at Cap Digital 🚀
Read also
Building news
Full portfolio coverage
Every building covered
From the single-family home to the tertiary establishment, each type is handled with the indicators that fit it.
Residential
Single-family homes, large and small condominiums, social housing. For each property: EPC, consumption, exposure to summer overheating, energy poverty, renovation and decarbonization potential.
Residential
Single-family homes, large and small condominiums, social housing. For each property: EPC, consumption, exposure to summer overheating, energy poverty, renovation and decarbonization potential.
Tertiary
Public administration, offices, retail, cafés-hotels-restaurants, education, healthcare, transport, sports-culture-leisure, communal housing. For each establishment: consumption and emissions by use, status under the tertiary decree, renewable-energy and renovation potential.
Tertiary
Public administration, offices, retail, cafés-hotels-restaurants, education, healthcare, transport, sports-culture-leisure, communal housing. For each establishment: consumption and emissions by use, status under the tertiary decree, renewable-energy and renovation potential.