
Measure traffic, speeds and emissions across your entire
road network
NEXQT reconstructs real traffic flows on your network using GPS data from the vehicles traveling on it. No sensors to install, no counting campaigns: your teams have the data they need from day one.


For local authorities and businesses
Daily data with 5 years of history
Passenger cars, light commercial vehicles, and heavy goods vehicles
Passenger cars, light commercial vehicles, and heavy goods vehicles
Referenced solution






Measure traffic, speeds and emissions across your entire road network
NEXQT reconstructs real traffic flows on your network using GPS data from the vehicles traveling on it. No sensors to install, no counting campaigns: your teams have the data they need from day one.
For local authorities and businesses
Daily data with 5 years of history
Entire road network across all territories
Passenger cars, light commercial vehicles, and heavy goods vehicles
Passenger cars, light commercial vehicles, and heavy goods vehicles
Referenced solution

Savoir où agir, décider en confiance, bâtiment par bâtiment
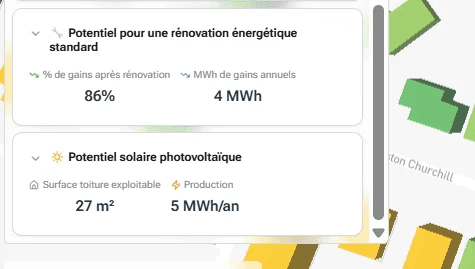
Sans capteur, sans collecte terrain : NEXQT reconstitue le jumeau numérique énergie-carbone de vos bâtiments, à l'échelle d'un territoire entier comme d'un parc immobilier, et donne à vos équipes les données pour prioriser les rénovations, cibler les financements et respecter vos obligations réglementaires.
Pour les collectivités et les entreprises
5 années d'historique sur l'entièreté de votre parc
Résidentiel, tertiaire privé, tertiaire public
Actualisation continue des données
Bâtiments logement et tertiaire
Solution référencée

For local authorities and businesses
Daily data with 5 years of history
Passenger cars, light commercial vehicles, and heavy goods vehicles
Passenger cars, light commercial vehicles, and heavy goods vehicles
Referenced solution
Deployed across more than 70 territories
Deployed across more than 70 territories



The Challenge
The Challenge
Your decisions are based on traffic data that is outdated, incomplete, and expensive to obtain.
Your decisions deserve reliable, up-to-date data
Your decisions deserve reliable, up-to-date data
Without continuous measurement, the real evolution of traffic flows remains invisible due to an information gap: new transit routes, the effects of a new development, drift in travel times. NEXQT reconstructs this data across your entire road network.
Without continuous measurement, the real evolution of traffic flows remains invisible due to an information gap: new transit routes, the effects of a new development, drift in travel times. NEXQT reconstructs this data across your entire road network.
Deployed across more than 70 territories
Traffic, speed, and emissions data for your entire road network
No sensors to install, no costly measurement campaigns: NEXQT delivers the digital twin of your road network and gives your teams the data they need to manage mobility.

Measure traffic, speeds and emissions across your entire road network
NEXQT reconstructs real traffic flows on your network using GPS data from the vehicles traveling on it. No sensors to install, no counting campaigns: your teams have the data they need from day one.

Traffic, speed, and emissions data for your entire road network
No sensors to install, no costly measurement campaigns: NEXQT delivers the digital twin of your road network and gives your teams the data they need to manage mobility.
Measure traffic, speeds and emissions across your entire road network
NEXQT reconstructs real traffic flows on your network using GPS data from the vehicles traveling on it. No sensors to install, no counting campaigns: your teams have the data they need from day one.
With NEXQT
The digital twin of your network
The digital twin of your network

Full network coverage, without physical sensors
Full network coverage, without physical sensors
Full network coverage, without physical sensors
Traffic, speeds, and emissions for all vehicle types
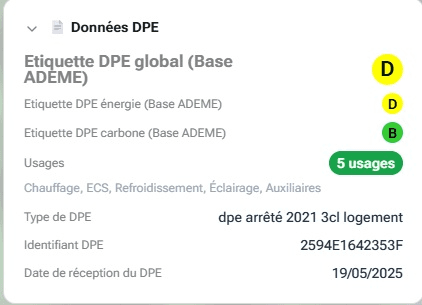
À l'adresse et à l'unité foncière
À l'adresse et à l'unité foncière
Segment by segment, day by day, over five years of history
Segment by segment, day by day, over five years of history
Segment by segment, day by day, over five years of history
A simple interface, accessible without technical expertise to all departments: roadworks, road safety, line operations, energy transition
A simple interface, accessible without technical expertise to all departments: roadworks, road safety, line operations, energy transition
A simple interface, accessible without technical expertise to all departments: roadworks, road safety, line operations, energy transition
02

100% of your network covered

02

Traffic speed emissions
03

Section by section
01
100% of your network covered
02

Traffic speed emissions
03
Section by section
02
100% of your network covered
02
Traffic speed emissions
03
Section by section
With NEXQT
The digital twin of your network
The digital twin of your network
The digital twin of your network

Measurements limited to a few roads and a few days leave an information gap
Measurements limited to a few roads and a few days leave an information gap
Measurements limited to a few roads and a few days leave an information gap

A snapshot that quickly becomes obsolete as soon as construction or a new development alters traffic flows.
A snapshot that quickly becomes obsolete as soon as construction or a new development alters traffic flows.
A snapshot that quickly becomes obsolete as soon as construction or a new development alters traffic flows.

No visibility on traffic shifts to neighboring routes
No visibility on traffic shifts to neighboring routes
No visibility on traffic shifts to neighboring routes
Travel times that are declared or taken from the outgoing operator, never actually measured on the ground
Travel times that are declared or taken from the outgoing operator, never actually measured on the ground
Travel times that are declared or taken from the outgoing operator, never actually measured on the ground
Decisions that are difficult to justify to residents, elected officials, or the Mobility Organizing Authority.
Decisions that are difficult to justify to residents, elected officials, or the Mobility Organizing Authority.
Decisions that are difficult to justify to residents, elected officials, or the Mobility Organizing Authority.
The Challenge
Your decisions deserve reliable, up-to-date data
Without continuous measurement, the real evolution of traffic flows remains invisible due to an information gap: new transit routes, the effects of a new development, drift in travel times. NEXQT reconstructs this data across your entire road network.
With NEXQT
The digital twin of your network
Measurements limited to a few roads and a few days leave an information gap
A snapshot that quickly becomes obsolete as soon as construction or a new development alters traffic flows.
No visibility on traffic shifts to neighboring routes
Travel times that are declared or taken from the outgoing operator, never actually measured on the ground
Decisions that are difficult to justify to residents, elected officials, or the Mobility Organizing Authority.
With NEXQT
The digital twin of your network
Full network coverage, without physical sensors
Traffic, speeds, and emissions for all vehicle types
Real travel times by route and time slot, to assess infrastructure projects, disruptions, or respond to a Public Service Delegation (DSP)
A simple interface, accessible without technical expertise to all departments: roadworks, road safety, line operations, energy transition
A simple interface, accessible without technical expertise to all departments: roadworks, road safety, line operations, energy transition
01

100% of your network covered
02

03
Where does our data come from?
Robust, representative data for the territory, sourced from vehicles

Calibrated data, not raw data
Là où l'information est absente, un modèle physique du bâti et des algorithmes d'apprentissage reconstituent la donnée manquante, calibrés sur les consommations réelles observées à proximité.
Calibrated data, not raw data
NEXQT agrège automatiquement des dizaines de bases officielles (Enedis, GRDF, DPE ADEME, cadastre, Fichier Foncier, FINESS…). Un moteur de geomatching rattache chaque enregistrement au bon bâtiment, à l'adresse et à l'unité foncière.

Where does our data come from?
Robust, representative data for the territory, sourced from vehicles


Published and verifiable reliability
The result is reliable data, quantified segment by segment, with a methodology published in leading international scientific journals. The data is anonymized and the processing is compliant with GDPR.
Calibrated data, not raw data
NEXQT then calibrates this FCD data using a physical traffic model and a machine learning algorithm, validated against reference permanent traffic counters.
Calibrated data, not raw data
NEXQT then calibrates this FCD data using a physical traffic model and a machine learning algorithm, validated against reference permanent traffic counters.
Calibrated data, not raw data
NEXQT then calibrates this FCD data using a physical traffic model and a machine learning algorithm, validated against reference permanent traffic counters.
Calibrated data, not raw data
NEXQT then calibrates this FCD data using a physical traffic model and a machine learning algorithm, validated against reference permanent traffic counters.
Calibrated data, not raw data
NEXQT then calibrates this FCD data using a physical traffic model and a machine learning algorithm, validated against reference permanent traffic counters.
Calibrated data, not raw data
NEXQT then calibrates this FCD data using a physical traffic model and a machine learning algorithm, validated against reference permanent traffic counters.
Des dizaines de sources, rapprochées bâtiment par bâtiment
NEXQT agrège automatiquement des dizaines de bases officielles (Enedis, GRDF, DPE ADEME, cadastre, Fichier Foncier, FINESS…). Un moteur de geomatching rattache chaque enregistrement au bon bâtiment, à l'adresse et à l'unité foncière.
Modélisation là où la donnée manque
Là où l'information est absente, un modèle physique du bâti et des algorithmes d'apprentissage reconstituent la donnée manquante, calibrés sur les consommations réelles observées à proximité.
Un indice de confiance sur chaque donnée
Chaque valeur est labellisée selon son origine : relevé compteur, DPE existant ou reconstitution. Vous savez toujours ce que vous regardez, et avec quel niveau de fiabilité. Les données sont traitées dans le respect du RGPD, sans aucune information nominative.

Significantly cheaper than a study
A counting campaign costs €5,000 to €10,000 per road, for a single location and a single moment.

Your teams, more autonomous
Training and support included. Your staff can produce their own analyses.

Always up-to-date data
Automatic monthly updates, with daily figures down to sub-hourly levels.

5 years of data available
No waiting or installation: five years of history for each segment, available from deployment.

5 years of data available
No waiting or installation: five years of history for each segment, available from deployment.
Your benefits
What you get out of it
Your benefits
What you get out of it
Without continuous measurement, the real evolution of traffic flows remains invisible due to an information gap: new transit routes, the effects of a new development, drift in travel times. NEXQT reconstructs this data across your entire road network.

Logement
Maisons individuelles, grandes et petites copropriétés, logements sociaux. Pour chaque bien : DPE, consommations, exposition à la surchauffe estivale, précarité énergétique, potentiels de rénovation et de décarbonation.

Tertiaire
Administration publique, bureaux, commerces, cafés-hôtels-restaurants, enseignement, santé, transport, sport-culture-loisirs, habitat communautaire. Pour chaque établissement : consommations et émissions par usage, statut au regard du décret tertiaire, potentiels EnR et de rénovation.
For whom?
Designed for local authorities and businesses.
Traffic data for all your roads
5 years of history
01
02
03
04
05
/03

Local authorities and departments
Territories of all sizes, from municipalities to Departments, both urban and rural, in France and Europe.
Mobility Organizing Authority
Observed traffic data across your entire area, to help decide on mobility plans and monitor their real effects.
Businesses
Public transport network operators (buses, coaches) and logistics and freight transport companies: real travel times by road, direction, and time slot, and measurement of the impact of disruptions.
Use Cases
A platform serving all your departments.
"Has my cycle path changed traffic flows in the neighborhood?"
Assess the impact of a cycling infrastructure project at the operation and neighborhood level, on both traffic and emissions. Concrete, quantified support for your Bike Plan.

"On which data should I base my travel times?"
NEXQT reports the speeds actually observed by segment, by direction and by time slot, and reconstructs travel times along your routes. You build your service design and your punctuality commitments on measured data, not on the outgoing operator's figures.

"How can I feed and monitor my mobility plan?"
Get a full network diagnosis by road hierarchy: congestion points, roads with recurring heavy traffic, zones with excessive speed.

"What is the actual cost of this construction site to my lines?"
Bridge closure, diversion, long-term works: measure the difference in travel time, traffic shifts to alternative routes, and the actual duration of the effect. Concrete, sourced data to justify service adjustments, contract amendments, or compensation to the AOM.

"Where are speed limits not being respected?"
NEXQT provides actually observed speeds (V15, V85, average speed) for each segment. Compare them to current limits and identify roads with recurring speeding issues with citizens and elected officials.

"What is the real effect of this project on traffic?"
Compare flows, speeds, and traffic shifts before and after a bypass, roundabout, or cycle path, road by road, over five years of history. You measure instead of estimating.

"What is the real effect of this project on traffic?"
Compare flows, speeds, and traffic shifts before and after a bypass, roundabout, or cycle path, road by road, over five years of history. You measure instead of estimating.
An example
The redevelopment of Rue du Général Leclerc
In Le Kremlin-Bicêtre, how do you measure the real effect of a 3-meter two-way bike lane and the removal of 25 parking spaces, on the street itself and on the surrounding neighborhood?
01.

The context

The method
NEXQT a construit un scoring combinant six critères pondérables : DPE, précarité énergétique, surchauffe estivale, distance au réseau de chaleur, potentiel solaire et pertinence d'une pompe à chaleur. Les seuils et les pondérations ont été fixés avec les équipes du territoire.
03.
The results
04.

L'usage
The context
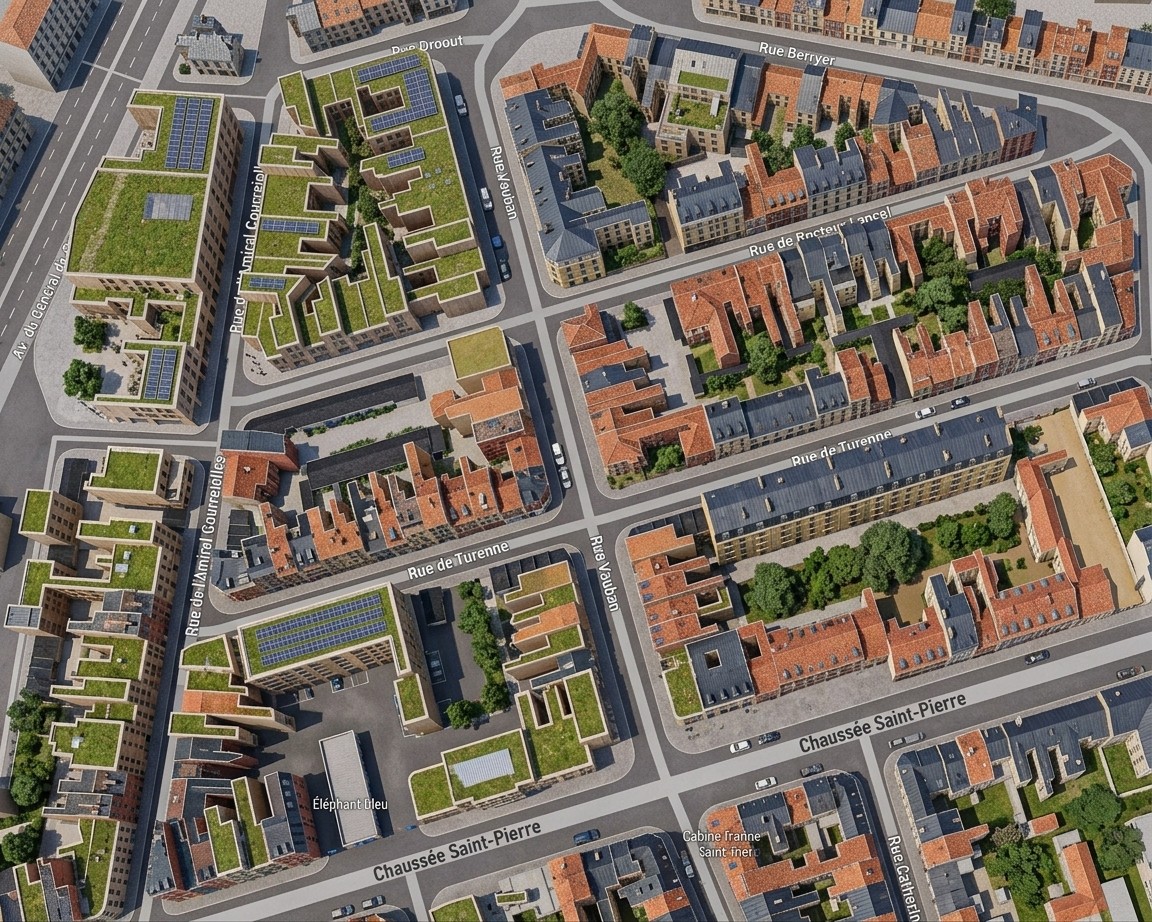
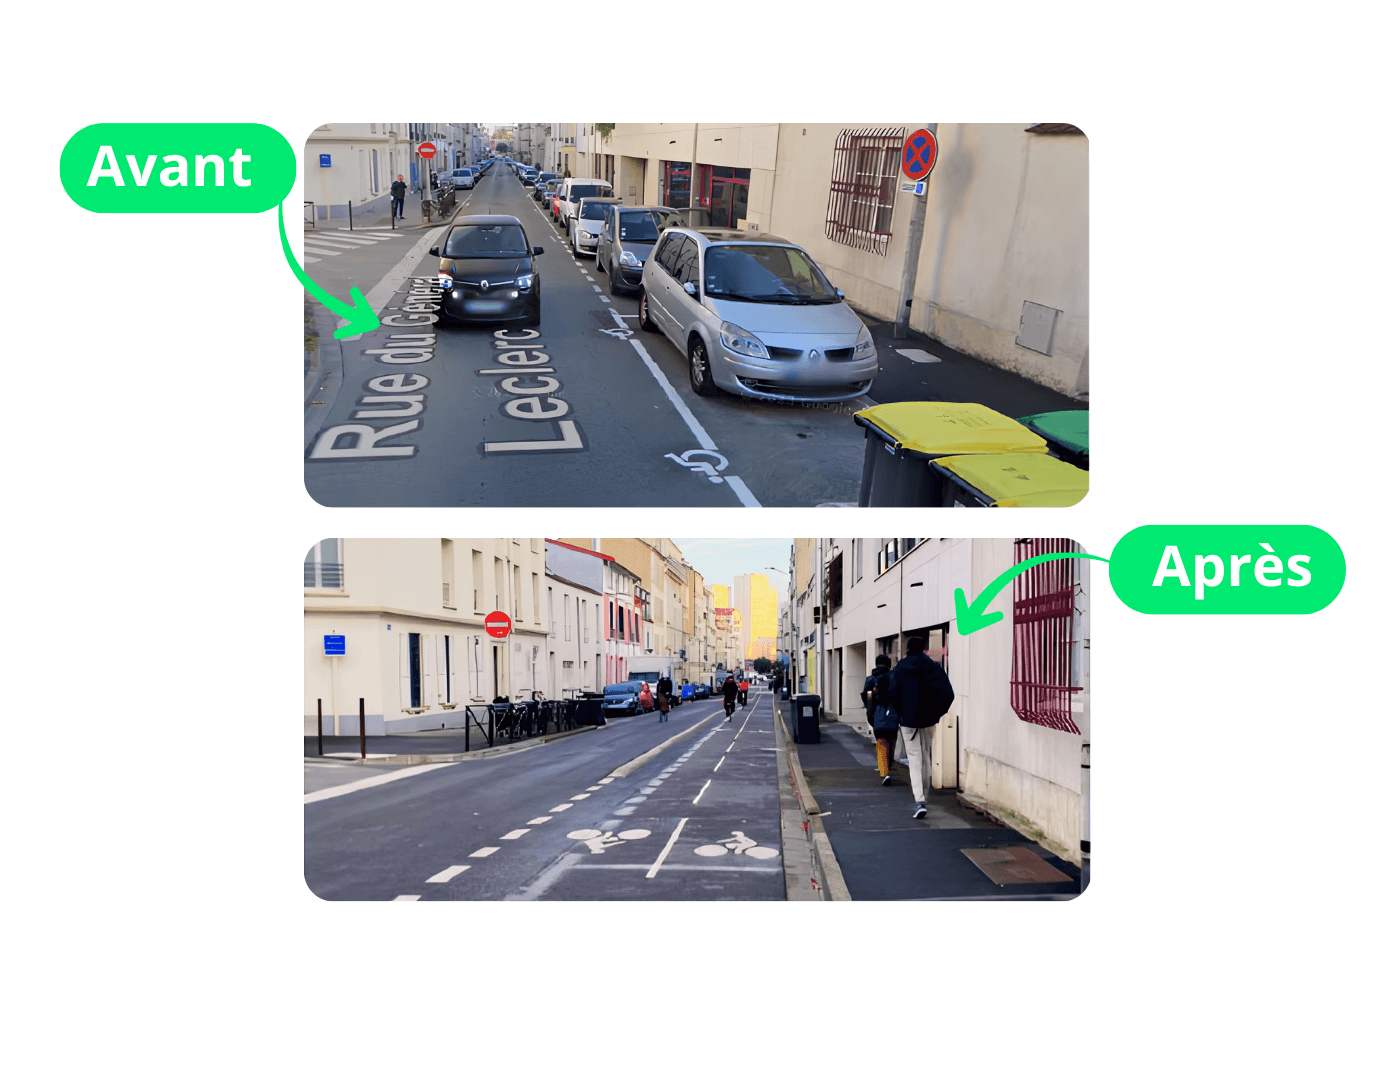
Before the redevelopment, the street was lined with continuous parking. Afterward, a bidirectional cycle track was installed.
The method
In a few clicks, the agent selects the impact zone on the map, then compares traffic and speeds before and after the redevelopment, segment by segment, over the selected period.

The results
52% less traffic on the redeveloped axis and 13% less on the wider impact zone, between 2022 and 2025. Factual, exportable, and verifiable figures.

Usage
To objectify dialogue with residents, elected officials, and partners: provide answers based on real data rather than impressions.
The context
Before the redevelopment, the street was lined with continuous parking. Afterward, a bidirectional cycle track was installed.
The method
In a few clicks, the agent selects the impact zone on the map, then compares traffic and speeds before and after the redevelopment, segment by segment, over the selected period.

The results
52% less traffic on the redeveloped axis and 13% less on the wider impact zone, between 2022 and 2025. Factual, exportable, and verifiable figures.

Usage
To objectify dialogue with residents, elected officials, and partners: provide answers based on real data rather than impressions.
Your custom diagnosis
Let's discuss your project: in 30 minutes, let's see together how NEXQT can support you.

Your custom diagnosis
Let's discuss your project: in 30 minutes, let's see together how NEXQT can support you.
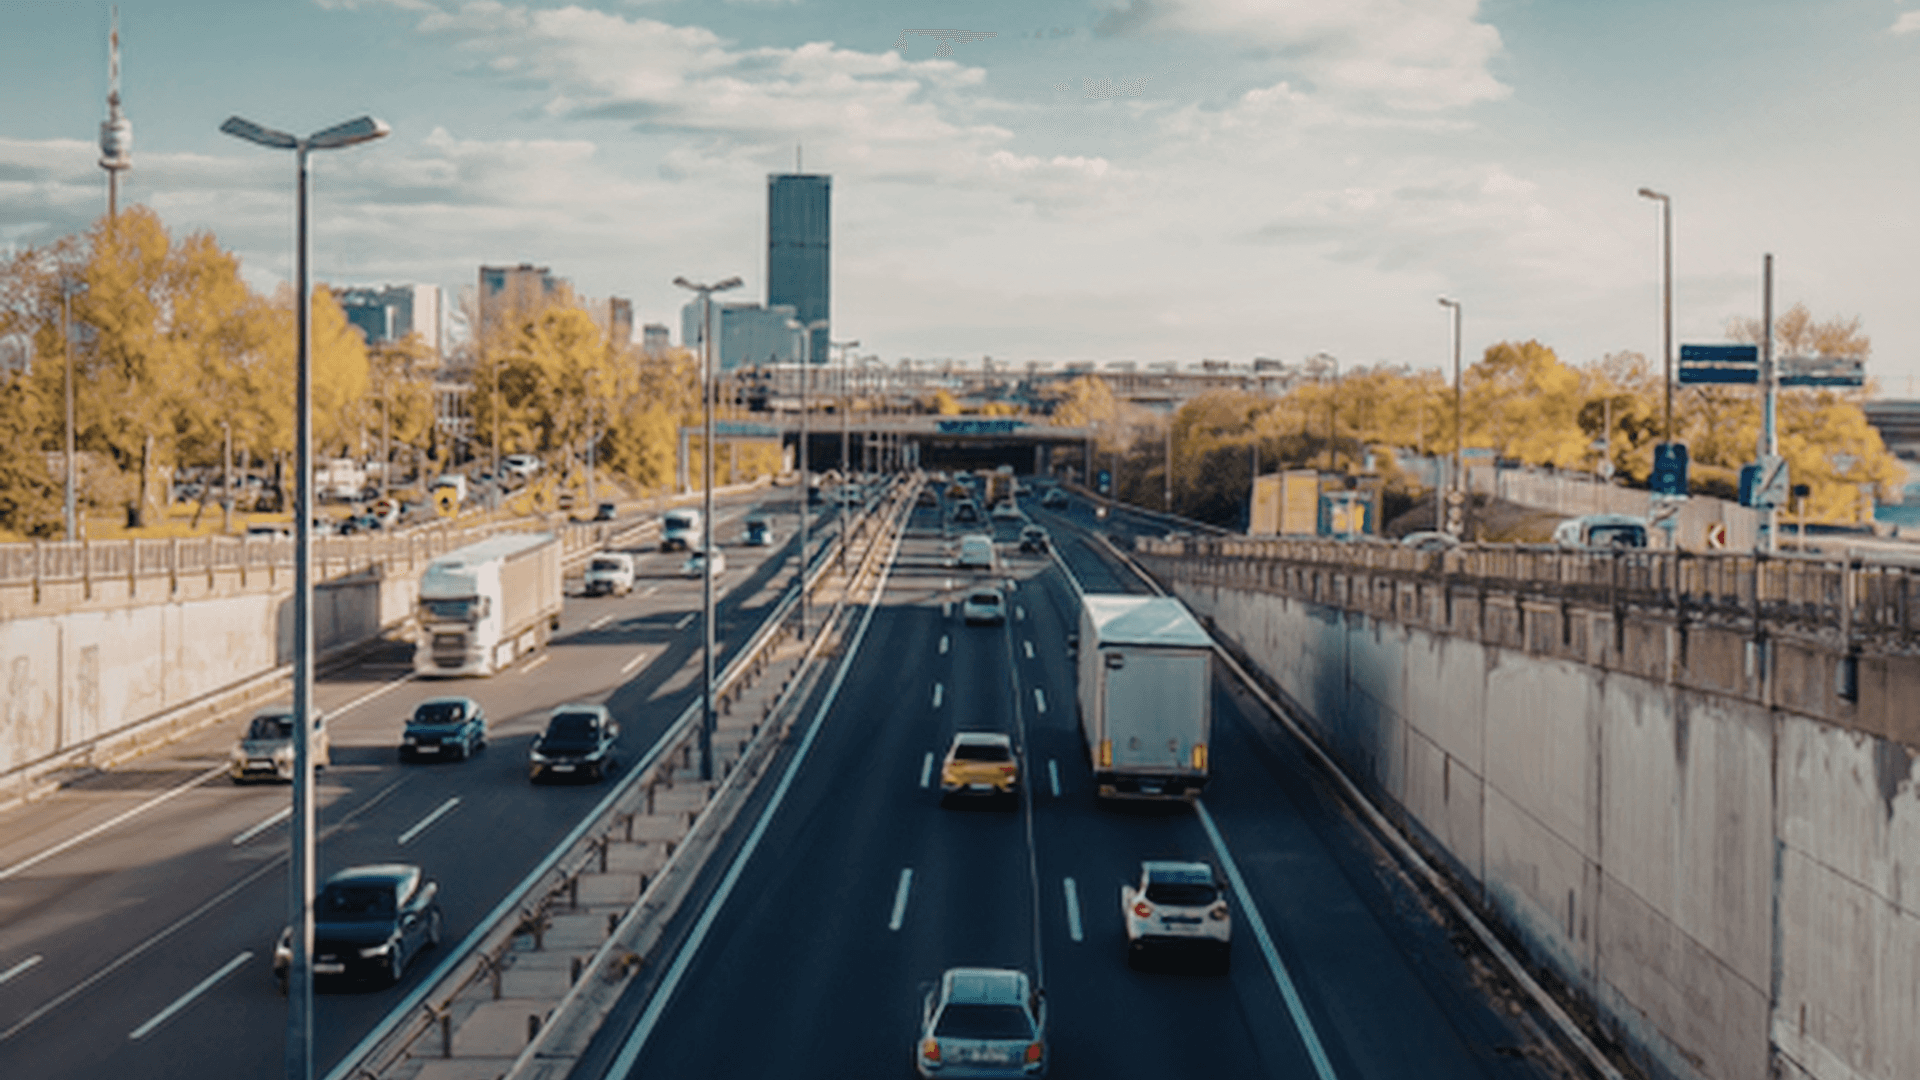
Where does our data come from?
Robust, representative data for the territory, sourced from vehicles
NEXQT then calibrates this FCD data using a physical traffic model and a machine learning algorithm, validated against reference permanent traffic counters.
Calibrated data, not raw data
NEXQT then calibrates this FCD data using a physical traffic model and a machine learning algorithm, validated against reference permanent traffic counters.
The result is reliable data, quantified segment by segment, with a methodology published in leading international scientific journals. The data is anonymized and the processing is compliant with GDPR.
Published and verifiable reliability
Chaque valeur est labellisée selon son origine : relevé compteur, DPE existant ou reconstitution. Vous savez toujours ce que vous regardez, et avec quel niveau de fiabilité. Les données sont traitées dans le respect du RGPD, sans aucune information nominative.

Where does our data come from?
Robust, representative data for the territory, sourced from vehicles
NEXQT then calibrates this FCD data using a physical traffic model and a machine learning algorithm, validated against reference permanent traffic counters.
Calibrated data, not raw data
NEXQT then calibrates this FCD data using a physical traffic model and a machine learning algorithm, validated against reference permanent traffic counters.
The result is reliable data, quantified segment by segment, with a methodology published in leading international scientific journals. The data is anonymized and the processing is compliant with GDPR.
Published and verifiable reliability
Chaque valeur est labellisée selon son origine : relevé compteur, DPE existant ou reconstitution. Vous savez toujours ce que vous regardez, et avec quel niveau de fiabilité. Les données sont traitées dans le respect du RGPD, sans aucune information nominative.

Where does our data come from?
Robust, representative data for the territory, sourced from vehicles
NEXQT then calibrates this FCD data using a physical traffic model and a machine learning algorithm, validated against reference permanent traffic counters.
Calibrated data, not raw data
NEXQT then calibrates this FCD data using a physical traffic model and a machine learning algorithm, validated against reference permanent traffic counters.
The result is reliable data, quantified segment by segment, with a methodology published in leading international scientific journals. The data is anonymized and the processing is compliant with GDPR.
Published and verifiable reliability
Chaque valeur est labellisée selon son origine : relevé compteur, DPE existant ou reconstitution. Vous savez toujours ce que vous regardez, et avec quel niveau de fiabilité. Les données sont traitées dans le respect du RGPD, sans aucune information nominative.
Your benefits
Your benefits
What's in it for you
What's in it for you
What's in it for you
Nettement moins cher qu'un audit
Un audit énergétique se fait bâtiment par bâtiment. NEXQT couvre tout votre parc pour un forfait, de quelques dizaines à plusieurs milliers de bâtiments.
Vos équipes plus autonomes
Formation et accompagnement inclus. Vos équipes produisent leurs propres analyses sans passer par un bureau d'études de programmation énergétique à chaque fois.
Une donnée toujours à jour
Mise à jour mensuelle automatique. Pas de photographie figée à refaire tous les six ans.
Prioriser sans subjectivité
Un scoring multicritères classe vos bâtiments selon les critères qui comptent pour vous : DPE, précarité, surchauffe, énergie fossile, potentiel CEE..

5 years of data available
No waiting or installation: five years of history for each segment, available from deployment.
5 years of data available
No waiting or installation: five years of history for each segment, available from deployment.
Nettement moins cher qu'un audit
Un audit énergétique se fait bâtiment par bâtiment. NEXQT couvre tout votre parc pour un forfait, de quelques dizaines à plusieurs milliers de bâtiments.
Vos équipes plus autonomes
Formation et accompagnement inclus. Vos équipes produisent leurs propres analyses sans passer par un bureau d'études de programmation énergétique à chaque fois.
Une donnée toujours à jour
Mise à jour mensuelle automatique. Pas de photographie figée à refaire tous les six ans.
Prioriser sans subjectivité
Un scoring multicritères classe vos bâtiments selon les critères qui comptent pour vous : DPE, précarité, surchauffe, énergie fossile, potentiel CEE..
5 years of data available
No waiting or installation: five years of history for each segment, available from deployment.
5 years of data available
No waiting or installation: five years of history for each segment, available from deployment.
5 years of data available
No waiting or installation: five years of history for each segment, available from deployment.
5 years of data available
No waiting or installation: five years of history for each segment, available from deployment.
For whom?
For whom?
Designed for local authorities and businesses.
Designed for local authorities and businesses.
Designed for local authorities and businesses.
Without continuous measurement, the real evolution of traffic flows remains invisible due to an information gap: new transit routes, the effects of a new development, drift in travel times. NEXQT reconstructs this data across your entire road network.
Without continuous measurement, the real evolution of traffic flows remains invisible due to an information gap: new transit routes, the effects of a new development, drift in travel times. NEXQT reconstructs this data across your entire road network.
Trafic journalier sur tous vos axes,
5 ans d'historique
01
02
03
04
05
/03
Collectivités locales de toutes tailles et Départements
Territories of all sizes, from municipalities to Departments, both urban and rural, in France and Europe.
Local authorities and departments
Territories of all sizes, from municipalities to Departments, both urban and rural, in France and Europe.
Local authorities and departments
Territories of all sizes, from municipalities to Departments, both urban and rural, in France and Europe.
Transport Organising Authorities (AOM)
Observed traffic data across your entire area, to help decide on mobility plans and monitor their real effects.
Transport Organising Authorities (AOM)
Observed traffic data across your entire area, to help decide on mobility plans and monitor their real effects.
Businesses
Public transport network operators (buses, coaches) and logistics and freight transport companies: real travel times by road, direction, and time slot, and measurement of the impact of disruptions.
Businesses
Public transport network operators (buses, coaches) and logistics and freight transport companies: real travel times by road, direction, and time slot, and measurement of the impact of disruptions.
Your benefits
What's in it for you
Without continuous measurement, the real evolution of traffic flows remains invisible due to an information gap: new transit routes, the effects of a new development, drift in travel times. NEXQT reconstructs this data across your entire road network.
Logement
Maisons individuelles, grandes et petites copropriétés, logements sociaux. Pour chaque bien : DPE, consommations, exposition à la surchauffe estivale, précarité énergétique, potentiels de rénovation et de décarbonation.
Logement
Maisons individuelles, grandes et petites copropriétés, logements sociaux. Pour chaque bien : DPE, consommations, exposition à la surchauffe estivale, précarité énergétique, potentiels de rénovation et de décarbonation.
Tertiaire
Administration publique, bureaux, commerces, cafés-hôtels-restaurants, enseignement, santé, transport, sport-culture-loisirs, habitat communautaire. Pour chaque établissement : consommations et émissions par usage, statut au regard du décret tertiaire, potentiels EnR et de rénovation.
Tertiaire
Administration publique, bureaux, commerces, cafés-hôtels-restaurants, enseignement, santé, transport, sport-culture-loisirs, habitat communautaire. Pour chaque établissement : consommations et émissions par usage, statut au regard du décret tertiaire, potentiels EnR et de rénovation.
Use Cases
Use Cases
Use Cases
A platform serving all your departments.
A platform serving all your departments.
A platform serving all your departments.
"What is the real effect of this project on traffic?"
"What is the real effect of this project on traffic?"
Compare flows, speeds, and traffic shifts before and after a bypass, roundabout, or cycle path, road by road, over five years of history. You measure instead of estimating.
Compare flows, speeds, and traffic shifts before and after a bypass, roundabout, or cycle path, road by road, over five years of history. You measure instead of estimating.
Compare flows, speeds, and traffic shifts before and after a bypass, roundabout, or cycle path, road by road, over five years of history. You measure instead of estimating.
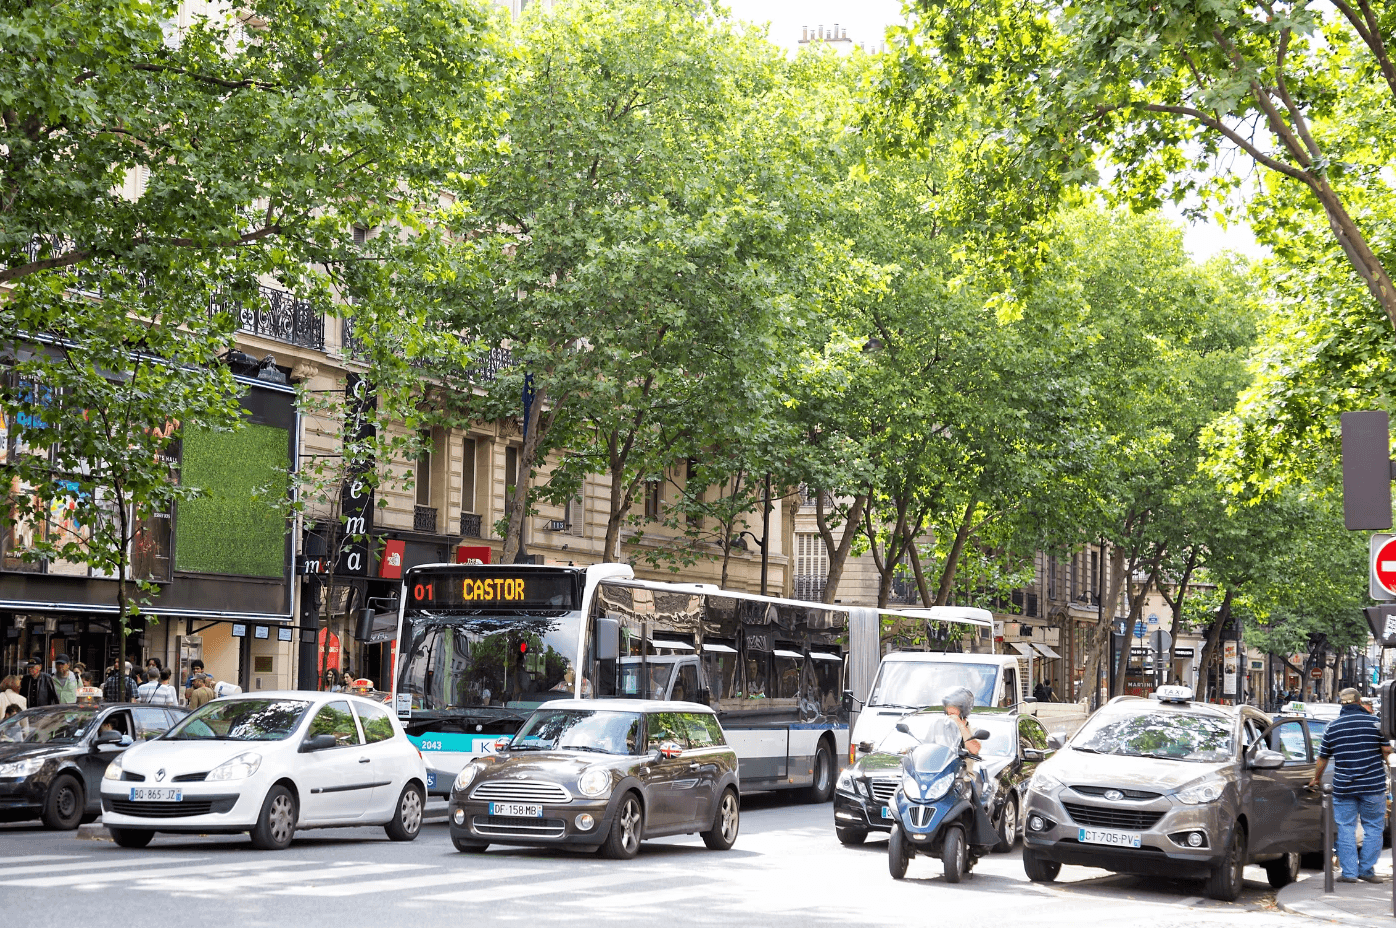


"Has my cycle path changed traffic flows in the neighborhood?"
"What is the real effect of this project on traffic?"
Compare flows, speeds, and traffic shifts before and after a bypass, roundabout, or cycle path, road by road, over five years of history. You measure instead of estimating.
Compare flows, speeds, and traffic shifts before and after a bypass, roundabout, or cycle path, road by road, over five years of history. You measure instead of estimating.

"Has my cycle path changed traffic flows in the neighborhood?"
"Has my cycle path changed traffic flows in the neighborhood?"
"Where are speed limits not being respected?"
NEXQT provides actually observed speeds (V15, V85, average speed) for each segment. Compare them to current limits and identify roads with recurring speeding issues with citizens and elected officials.
NEXQT provides actually observed speeds (V15, V85, average speed) for each segment. Compare them to current limits and identify roads with recurring speeding issues with citizens and elected officials.


"What is the actual cost of this construction site to my lines?"
"What is the actual cost of this construction site to my lines?"
Bridge closure, diversion, long-term works: measure the difference in travel time, traffic shifts to alternative routes, and the actual duration of the effect. Concrete, sourced data to justify service adjustments, contract amendments, or compensation to the AOM.
Bridge closure, diversion, long-term works: measure the difference in travel time, traffic shifts to alternative routes, and the actual duration of the effect. Concrete, sourced data to justify service adjustments, contract amendments, or compensation to the AOM.
Bridge closure, diversion, long-term works: measure the difference in travel time, traffic shifts to alternative routes, and the actual duration of the effect. Concrete, sourced data to justify service adjustments, contract amendments, or compensation to the AOM.


"Has my cycle path changed traffic flows in the neighborhood?"
"Has my cycle path changed traffic flows in the neighborhood?"
"Has my cycle path changed traffic flows in the neighborhood?"
"Has my cycle path changed traffic flows in the neighborhood?"
Assess the impact of a cycling infrastructure project at the operation and neighborhood level, on both traffic and emissions. Concrete, quantified support for your Bike Plan.
Assess the impact of a cycling infrastructure project at the operation and neighborhood level, on both traffic and emissions. Concrete, quantified support for your Bike Plan.
Assess the impact of a cycling infrastructure project at the operation and neighborhood level, on both traffic and emissions. Concrete, quantified support for your Bike Plan.


"Has my cycle path changed traffic flows in the neighborhood?"
"On which data should I base my travel times?"
"On which data should I base my travel times?"
NEXQT reports the speeds actually observed by segment, by direction and by time slot, and reconstructs travel times along your routes. You build your service design and your punctuality commitments on measured data, not on the outgoing operator's figures.
NEXQT reports the speeds actually observed by segment, by direction and by time slot, and reconstructs travel times along your routes. You build your service design and your punctuality commitments on measured data, not on the outgoing operator's figures.
NEXQT reports the speeds actually observed by segment, by direction and by time slot, and reconstructs travel times along your routes. You build your service design and your punctuality commitments on measured data, not on the outgoing operator's figures.


"Has my cycle path changed traffic flows in the neighborhood?"
"How can I feed and monitor my mobility plan?"
"How can I feed and monitor my mobility plan?"
Get a full network diagnosis by road hierarchy: congestion points, roads with recurring heavy traffic, zones with excessive speed.
Get a full network diagnosis by road hierarchy: congestion points, roads with recurring heavy traffic, zones with excessive speed.
Get a full network diagnosis by road hierarchy: congestion points, roads with recurring heavy traffic, zones with excessive speed.


"Has my cycle path changed traffic flows in the neighborhood?"
In practice
Un exemple
Un exemple
The redevelopment of Rue du Général Leclerc
The redevelopment of Rue du Général Leclerc
The redevelopment of Rue du Général Leclerc
In Le Kremlin-Bicêtre, how do you measure the real effect of a 3-meter two-way bike lane and the removal of 25 parking spaces, on the street itself and on the surrounding neighborhood?
In Le Kremlin-Bicêtre, how do you measure the real effect of a 3-meter two-way bike lane and the removal of 25 parking spaces, on the street itself and on the surrounding neighborhood?
In Le Kremlin-Bicêtre, how do you measure the real effect of a 3-meter two-way bike lane and the removal of 25 parking spaces, on the street itself and on the surrounding neighborhood?

The context
Avant l’aménagement, la rue était bordée de stationnement continu. Après, une piste cyclable bidirectionnelle a pris place.
02.
The method
03.
The results
04.
L'usage

The context
L'Etablissement Public Territorial devait orienter un fonds de rénovation vers les bâtiments les plus critiques de son parc social. Sans données comparables d'un bailleur à l'autre, l'arbitrage reposait sur des dossiers hétérogènes et des priorités déclarées.
The method
NEXQT a construit un scoring combinant six critères pondérables : DPE, précarité énergétique, surchauffe estivale, distance au réseau de chaleur, potentiel solaire et pertinence d'une pompe à chaleur. Les seuils et les pondérations ont été fixés avec les équipes du territoire.
The results
14 bâtiments en priorité absolue, soit 1 761 logements, et 518 en priorité haute, soit 21 530 logements, sur les 114 321 du parc. Un classement partagé, ajustable et défendable, qui oriente l'investissement sur des faits plutôt que sur des impressions.
L'usage
Le même jeu de données sert au-delà du fonds : en croisant consommations, énergies à substituer et distance au réseau existant, le territoire identifie ses bâtiments raccordables et chiffre un potentiel de densification ou d'extension pour son schéma directeur.
The context
L'Etablissement Public Territorial devait orienter un fonds de rénovation vers les bâtiments les plus critiques de son parc social. Sans données comparables d'un bailleur à l'autre, l'arbitrage reposait sur des dossiers hétérogènes et des priorités déclarées.
The method
NEXQT a construit un scoring combinant six critères pondérables : DPE, précarité énergétique, surchauffe estivale, distance au réseau de chaleur, potentiel solaire et pertinence d'une pompe à chaleur. Les seuils et les pondérations ont été fixés avec les équipes du territoire.
The results
14 bâtiments en priorité absolue, soit 1 761 logements, et 518 en priorité haute, soit 21 530 logements, sur les 114 321 du parc. Un classement partagé, ajustable et défendable, qui oriente l'investissement sur des faits plutôt que sur des impressions.

L'usage
Le même jeu de données sert au-delà du fonds : en croisant consommations, énergies à substituer et distance au réseau existant, le territoire identifie ses bâtiments raccordables et chiffre un potentiel de densification ou d'extension pour son schéma directeur.
Your custom diagnosis
Let's discuss your project: in 30 minutes, let's see together how NEXQT can support you.

Your custom diagnosis
Let's discuss your project: in 30 minutes, let's see together how NEXQT can support you.
Your custom diagnosis
Let's discuss your project: in 30 minutes, let's see together how NEXQT can support you.
Your custom diagnosis
Let's discuss your project: in 30 minutes, let's see together how NEXQT can support you.
Read also
Read also
Read also
Mobility News
Mobility News
Mobility News

ACTUALITÉ
📍 On se retrouve au salon de l’AMIF (Association des Maires d'Ile-de-France) la semaine prochaine !

ACTUALITÉ
La meilleure façon d’accompagner la transition des villes et des acteurs privés ? Montrer l’exemple

ACTUALITÉ
📢 On vous attend demain à Cap Digital 🚀
Read also
Mobility News
Your benefits
What's in it for you
Without continuous measurement, the real evolution of traffic flows remains invisible due to an information gap: new transit routes, the effects of a new development, drift in travel times. NEXQT reconstructs this data across your entire road network.
Logement
Maisons individuelles, grandes et petites copropriétés, logements sociaux. Pour chaque bien : DPE, consommations, exposition à la surchauffe estivale, précarité énergétique, potentiels de rénovation et de décarbonation.
Logement
Maisons individuelles, grandes et petites copropriétés, logements sociaux. Pour chaque bien : DPE, consommations, exposition à la surchauffe estivale, précarité énergétique, potentiels de rénovation et de décarbonation.
Tertiaire
Administration publique, bureaux, commerces, cafés-hôtels-restaurants, enseignement, santé, transport, sport-culture-loisirs, habitat communautaire. Pour chaque établissement : consommations et émissions par usage, statut au regard du décret tertiaire, potentiels EnR et de rénovation.
Tertiaire
Administration publique, bureaux, commerces, cafés-hôtels-restaurants, enseignement, santé, transport, sport-culture-loisirs, habitat communautaire. Pour chaque établissement : consommations et émissions par usage, statut au regard du décret tertiaire, potentiels EnR et de rénovation.